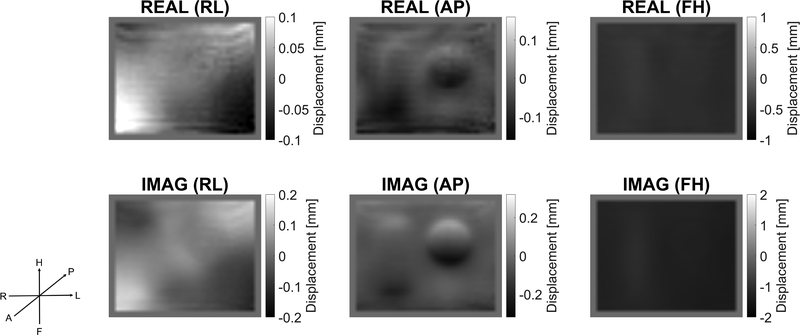
Figure 6:
Displacement data after Fourier filtering to yield the 1 Hz response signal. Displacement directions are shown in the LPH coordinate system. Note that the scale of the displacements is largest in the push direction, FH, and smaller in the other directions. Slice is 16 (of 24, see Fig 3, middle graphic).

