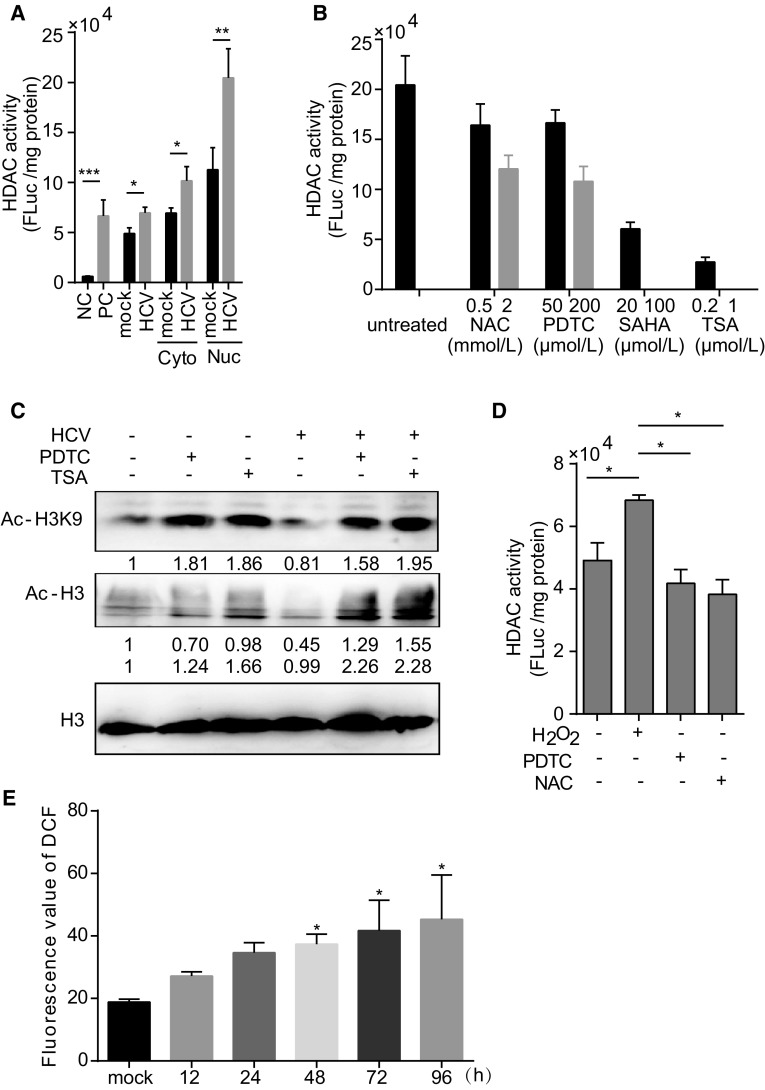
Fig. 1.
HCV infection increases HDAC activity. (A) HDAC activity in the cytoplasm and nucleus in mock- and HCV-infected Huh7 cells. HeLa cell extract was used as a positive control (PC), and TSA-treated HeLa cell extract was used as a negative control (NC). (B) HDAC activity in HCV-infected Huh7 cells treated with NAC, PDTC, SAHA, or TSA, or left untreated. (C) Western blot analysis of histone H3 (Ac-H3) and histone H3 lysine 9 (Ac-H3K9) acetylation. Histone H3 was used as an internal control. (D) HDAC activity in mock- and HCV-infected Huh7 cells pretreated with PDTC or NAC for 1 h, then stimulated with H2O2 (200 μmol/L) for 8 h. (E) Fluorescence intensity of 2′,7′-dichlorodihydrofluorescein (DCF) as an indicator of ROS production. Data are presented as mean ± SD of three independent experiments. P values in (A) and (D) were determined by unpaired two-tailed student t test and P values in (E) were determined by ANOVA. *P < 0.05; **P < 0.01; ***P < 0.001.

