Fig. 6.

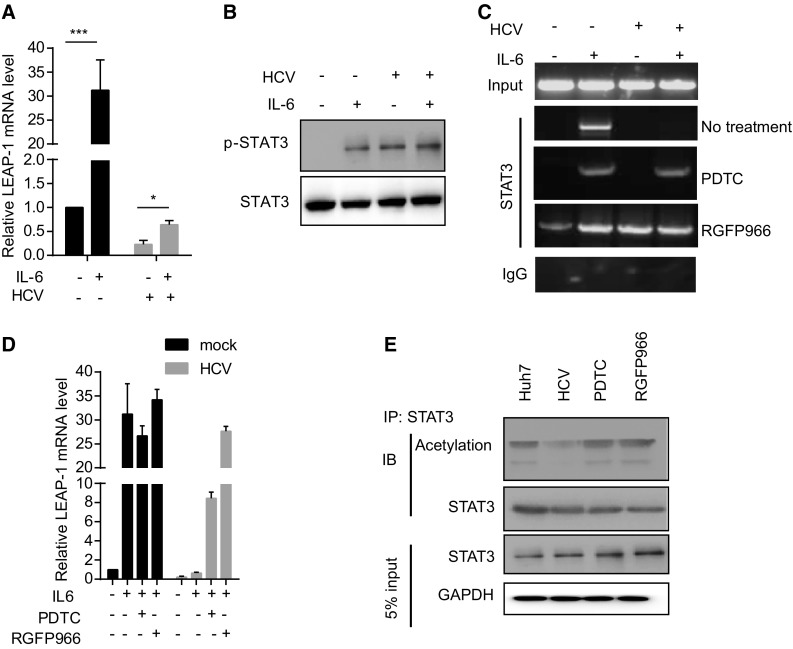
LEAP-1 expression in response to IL-6. Huh7 cells were cultured with 10 ng/mL IL-6 for 16 h. (A) LEAP-1 mRNA level was evaluated by qRT-PCR and normalized to that of actin. (B) STAT3 and phospho-STAT3 protein levels were analyzed by Western blotting. (C) Cells were pretreated with 100 μmol/L PDTC or 10 μmol/L RGFP966 for 8 h, then cultured in the presence of IL-6 for 16 h. ChIP for phospho-STAT3 was carried out, with rabbit IgG serving as a negative control. (D) Cells were pretreated as in panel (C), and LEAP-1 mRNA level was evaluated by qRT-PCR and normalized to that of actin. Data represent mean ± SD. (E) Total cell lysates from HCV-infected cells incubated with 100 μmol/L PDTC or 10 μmol/L RGFP966 for 4 h were immunoprecipitated (IP) with STAT3 antibody. Proteins were immunoblotted (IB) with an antibody against STAT3 (lower panel) or acetyllysine (Acetylation; upper panel). Data are representative of three independent experiments. P values in A were determined by unpaired two-tailed student t test. *P < 0.05; ***P < 0.01.
