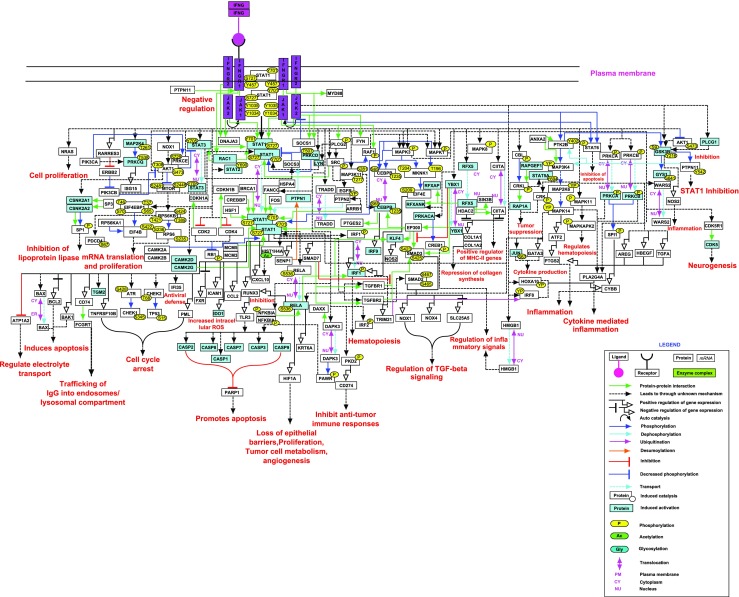
Fig. 1.

A graphical representation of IFN-γ signaling pathway. The pathway map represents reactions of IFN-γ signaling pathway that are documented in NetPath. Different types of reactions and molecules are distinguished with different colors and arrows as provided in the legend. Solid arrows represent direct reactions and a dashed arrow represents reactions whose mechanisms are currently unknown. Post-translational modifications with site and residues are also provided in the map
