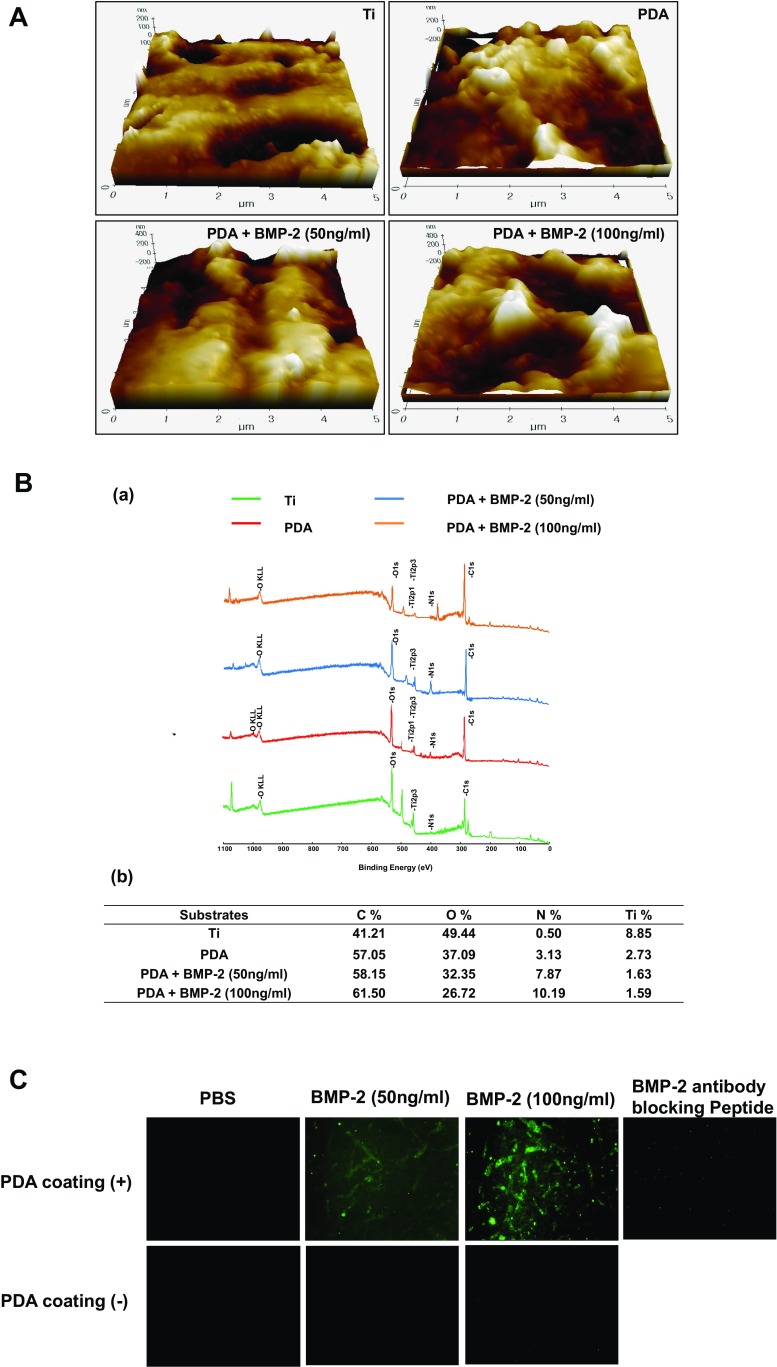
Fig. 2.
Surface characterization of modified Ti substrates. a AFM images of Ti, PDA, PDA/BMP-2 (50 ng/ml), and PDA/BMP-2 (100 ng/ml)-Ti substrates. The scale bar indicates 5 μm. b XPS peaks of Ti, PDA, PDA/BMP-2 (50 ng/ml), and PDA/BMP-2 (100 ng/ml)-Ti substrates (a), quantification of atomic chemical composition of each Ti surface (b). c Fluorescent visualization of labeled FITC-BMP-2 antibody immobilized onto pristine Ti (PT) or PDA-coated Ti substrates. The specific binding affinity of BMP-2 antibody was also assessed using blocking peptide

