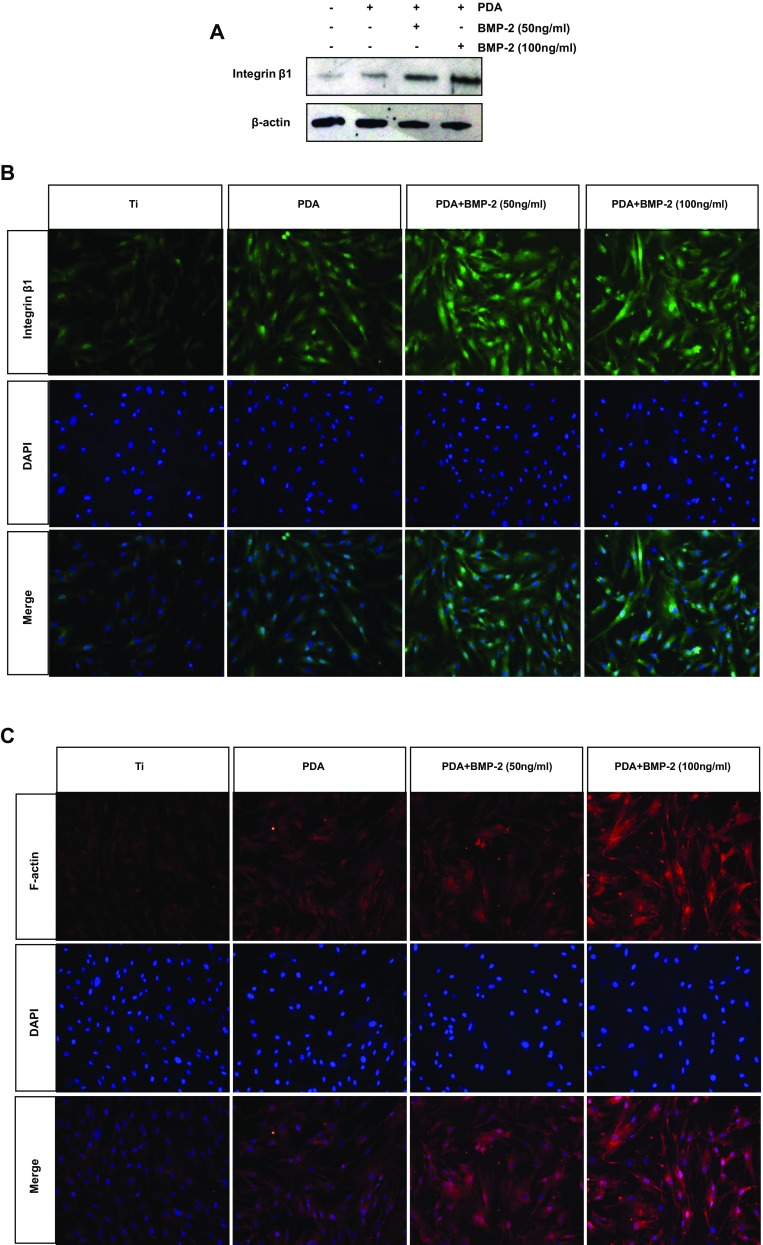
Fig. 5.

Evaluation of integrin β1 and F-actin proteins in PDLSCs. a Cells were cultured on each Ti substrate for 7 days, and then the protein levels of integrin β1 were determined by western blot analysis. The fluorescent visualization of (b) integrin β1 and (c) F-actin were assessed (magnification 200×). The nuclei were stained with DAPI (blue staining)
