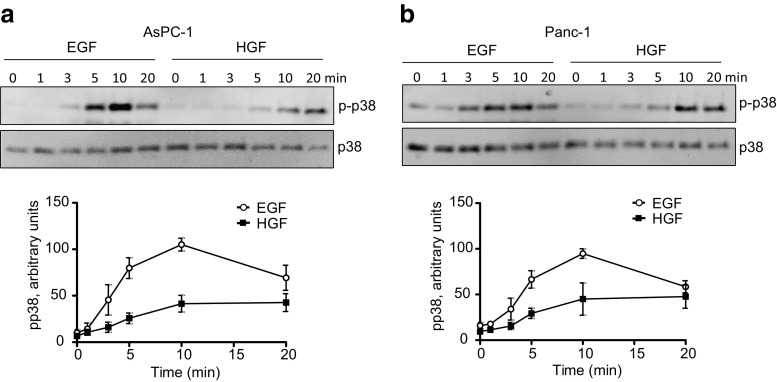
Fig. 1.
EGF- and HGF-induced phosphorylation of p38. Immunoblots show p38 phosphorylation induced by 10 nM EGF and 1 nM HGF in AsPC-1 (a) and Panc-1 (b) cells. The graphs show densitometric quantification of p38 phosphorylation based on three independent experiments ± SEM. The signal strength of p38 was used as a loading control and the amount of p-p38 was normalized to total p38

