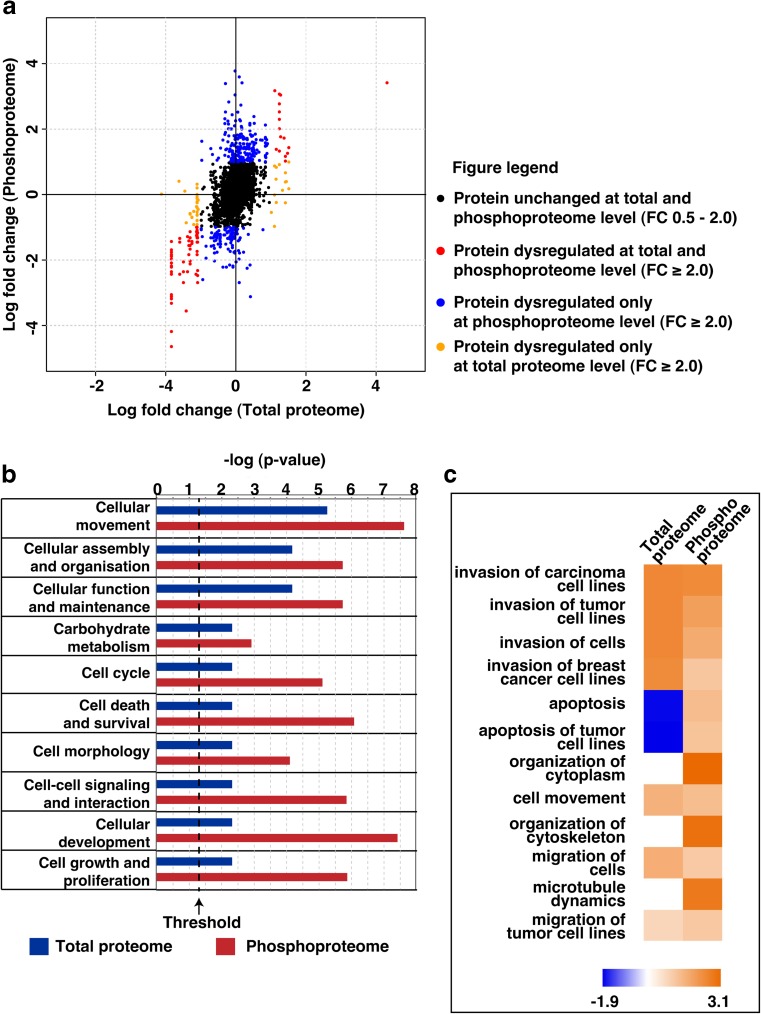
Fig. 2.
a Quadrant plot depicting log fold change of proteins at proteome and phosphoproteome level in OKF6/TERT1-Smoke cells compared to OKF6/TERT1-Parental cells. b Ingenuity pathway analysis of dysregulated proteins (≥2 fold) and differentially phosphorylated proteins (≥2 fold) in smoke exposed cells compared to parental cells. Top ten significant (p ≤ 0.05) molecular and cellular functions as observed in OKF6/TERT1-Smoke cells. c Top twelve significant (p ≤ 0.05) functions annotated under ‘Cellular Movement’

