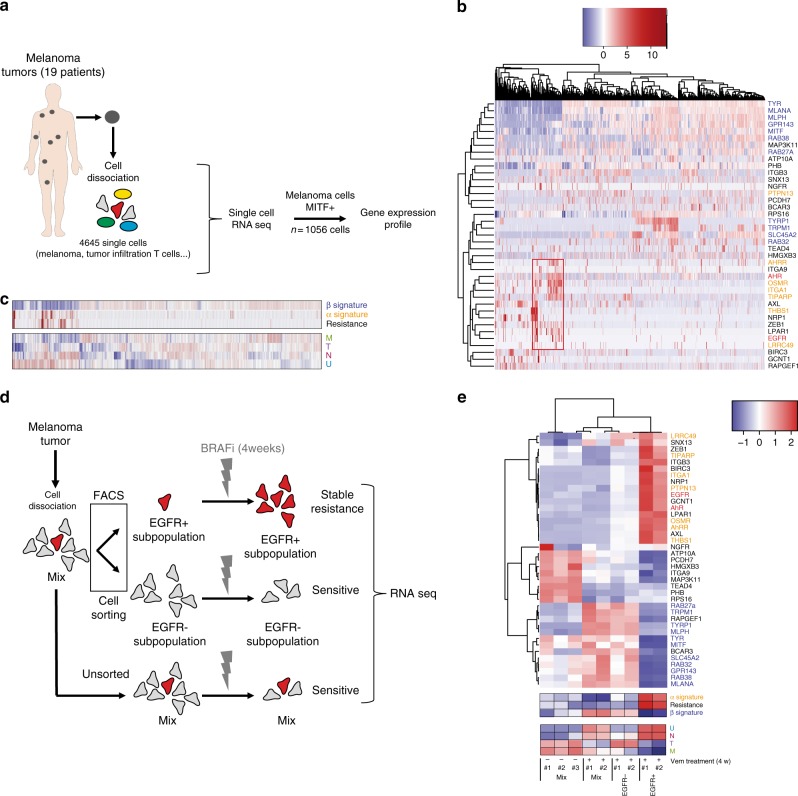
Fig. 4.
Role of AhR in melanoma cell resistance: single cell analyses. a Schematic representation of analysis of data from single cell analysis of BRAFi-resistant melanoma (19 patients). Cells from tumors of the different patients have been dissociated and individually sequenced for RNA expression (4650 cells) (RNAseq dataset, GEO, GSE7205633). One filter has been included to only focus on melanoma cells expressing the MITF gene. b Expression Heatmap for genes corresponding to α- and β-signatures and depicting mRNA expression of individual genes for BRAFi resistance genes using data from single cell analysis of BRAFi-resistant melanoma (19 patients) (1056 cells). c Expression heatmap for average β-, α-, and resistance signatures (top) and melanoma differentiated state signatures using data from single cell analysis of BRAFi-resistant melanoma. d Schematic representation of analysis of data using an RNA-Seq dataset obtained from BRAFi-treated melanoma cells (from 2 patients) (from supplemented information16). Cell sorting has been performed on dissociated tumors to isolate EGFR-negative or -positive cells that are able to resist BRAFis and to generate colonies after long-term treatment. e Expression heatmap for genes corresponding to individual genes (top) of α- and β-signatures and depicting mRNA expression for BRAFi resistance, average signatures (middle) and differentiated state signatures (bottom) using an RNA-Seq dataset obtained from BRAFi-treated melanoma cells16. The human silhouettes have been adapted (change of color background) from Servier Medical Art, licensed under a CC BY 3.0 FR [https://smart.servier.com/smart_image/shape-29/]

