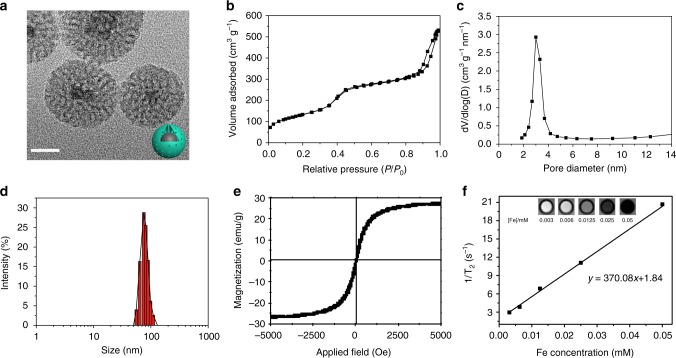
Fig. 2.
Structural and compositional characterizations of MMSNs. a TEM image of MMSNs. Scale bar: 20 nm. b N2 adsorption−desorption isotherm and c corresponding pore-size distribution of MMSNs. d The hydrodynamic particle-size distribution of MMSNs in aqueous solution by DLS measurement. e Field-dependent magnetization curve of MMSNs measured at room temperature. f Plots of T2−1 versus Fe concentration and concentration-dependent T2-weighted MR imaging for MMSNs solution. Transverse relaxivity (r2) was derived from linear fitting of the plots

