Fig. 5.
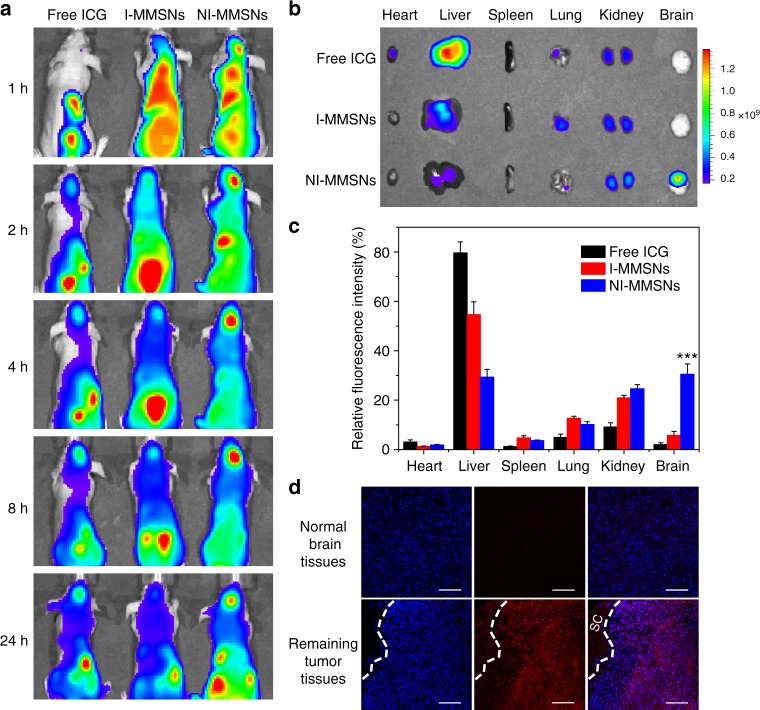
In vivo biodistribution of neutrophils carrying MMSNs. a In vivo fluorescence images of postsurgical glioma-bearing mice captured at the indicated time points after intravenous administration of free ICG, I-MMSNs, and NI-MMSNs. b Ex vivo fluorescence images of major organs excised from mice intravenously injected with free ICG, I-MMSNs, and NI-MMSNs at 4 h of postinjection. c Quantification analysis of relative fluorescence intensity in the organs at 4 h after intravenous injection. Mean values and error bars are defined as mean and s.d., respectively (n = 3). Statistical significance is assessed by Student’s two-sided t test compared to the control group. ***P < 0.001. d CLSM images of normal brain tissues and remaining tumor tissues in the postsurgical glioma-bearing mice after injection of NI-MMSNs. SC indicates the surgical cavity. Blue fluorescence: nuclei, red fluorescence: ICG. Scale bar: 100 μm

