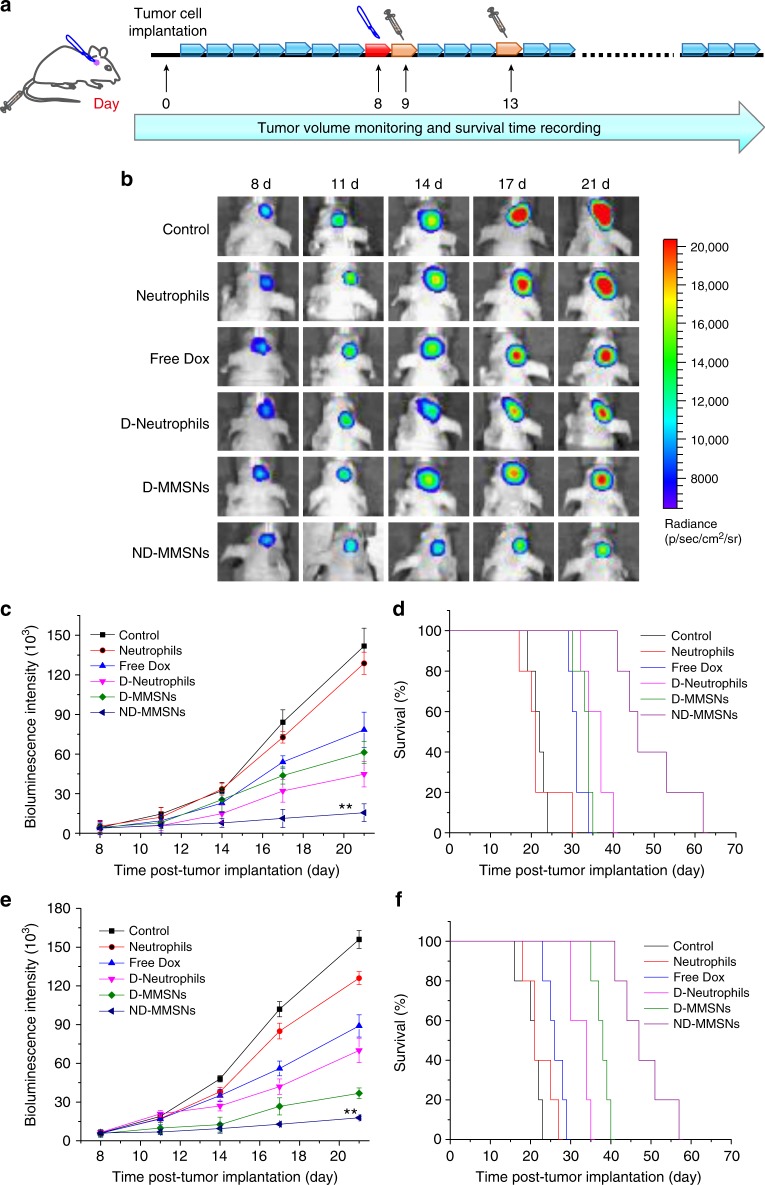
Fig. 6.
In vivo therapeutic performance of ND-MMSNs. a Schematic illustration of in vivo therapeutic schedule of mice after U87-Luc glioma cells implantation, primary glioma resection, and treatment of ND-MMSNs delivery system. b In vivo bioluminescent images, c quantified signal intensity and d survival curves of U87 glioma-bearing mice from each group after various treatment indicated. Statistical significance is assessed by Student’s two-sided t test compared to the control group. **P < 0.01. e Quantified signal intensity and f survival curves of C6 glioma-bearing mice from each group after various treatment indicated. Statistical significance is assessed by Student’s two-sided t test compared to the control group. **P < 0.01. Mean values and error bars are defined as mean and s.d., respectively (n = 5)

