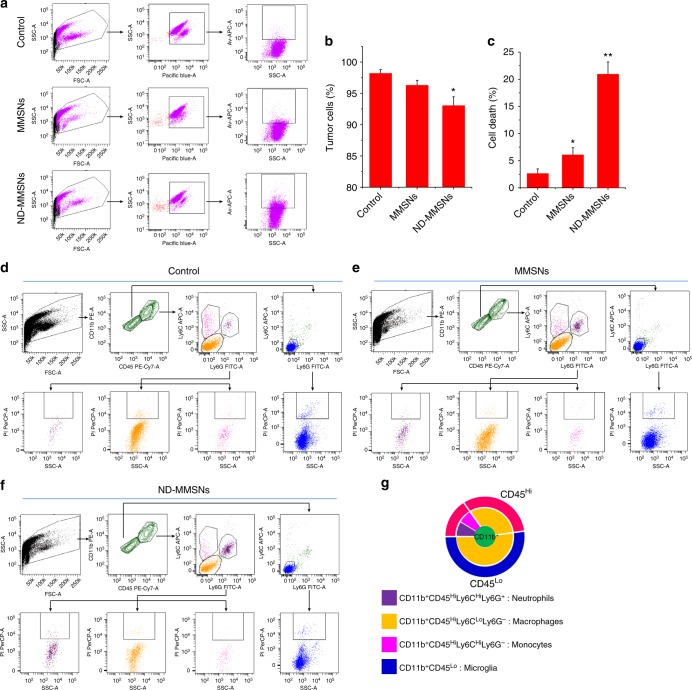
Fig. 7.
Flow cytometry evaluation of in vivo therapeutic mechanisms. a−c The single tumor cell suspension was stained by d-luciferin potassium salt and APC-labeled Annexin V apoptosis detection kit. The tumor cell ratio and the apoptotic tumor cells were determined by flow cytometry. Luciferin fluorescence that stands for tumor cells was detected with Pacific blue channel. Mean values and error bars are defined as mean and s.d., respectively (n = 3). Statistical significance is assessed by Student’s two-sided t test compared to the control group. *P < 0.05 and **P < 0.01. d−f Representative dot plots gated on the CD45+CD11b+ cells from tumors generated in U87 mice. The total population of CD45+CD11b+ cells is considered to be 100%, with CD11b+CD45Hi (neutrophils, monocytes, and macrophages) and CD11b+CD45lo (resident brain microglia) populations gated separately. Their expression of Ly6C and Ly6G was analyzed and the percentage of each subpopulation was quantified. The apoptotic cells in each subpopulation were also determined by PI. g Schematic diagram of tumor-associated macrophage ratio

