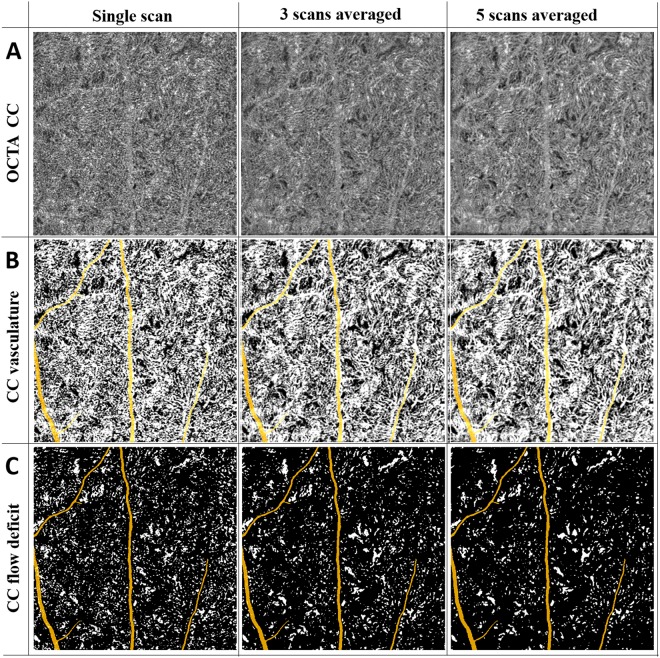
Figure 9.
Visual illustration of CC FDs detection with averaging for the scans obtained from equatorial region. (Panel A) Macular CC OCTA images with single scan, three scans averaged, and five scans averaged, respectively. (Panel B) Macular CC vasculature segmented by fuzzy c-means algorithm with single scan, three scans averaged, and five scans averaged, respectively. (Panel C) Segmented macular CC FD with single scan, three scans averaged, and five scans averaged, respectively.

