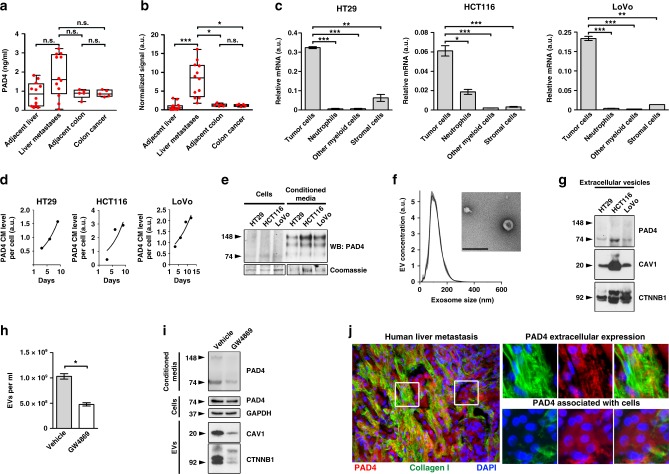
Fig. 3.
PAD4 is produced by CRC cells and is contained in EVs. a ELISA for PAD4 was performed on tissue lysates extracted from human CRC hepatic metastases, paired adjacent liver tissues (n = 12 per group), human CRC lesions and paired adjacent colon tissues (n = 5 per group). b Densitometric analysis of immunoblotting for PAD4 performed on tissue lysates of human with CRC hepatic metastases and paired adjacent unaffected liver tissues (n = 12) and human primary CRC lesions and paired adjacent unaffected colon tissues (n = 5). For the densitometry, the most expressed 148 kDa dimer band was measured. Densitometry was normalized to loading control. c Relative (to HPRT) mRNA levels of PAD4 in CRC cells, granulocytes, other myeloid cells and the stromal cells isolated from CRC experimental hepatic metastases (n = 2 biological replicates per group). d ELISA for PAD4 was performed on the conditioned media collected from cultured CRC cells at the indicated time points and normalized to the total cell number. e Immunoblotting for PAD4 was performed on HT29, HCT116 and LoVo cells and their corresponding conditioned media 6 days post-seeding. Coomassie stain was used as a loading control. f Nanoparticle tracking analysis of particle size distribution (graph) and electron microscopy (image) of EVs isolated from HT29 cells. Scale bar = 250 nm. g Immunoblotting for indicated proteins in EVs isolated from CRC cells. Representative of two experiments. h Nanoparticle tracking analysis of particle concentration of EVs collected from HT29 cells treated with vehicle or GW4869. i Immunoblotting for indicated proteins in cells, conditioned media and EVs from cultured HT29 cells treated with vehicle or GW4869. j Representative images of co-immunostaining for PAD4 and collagen I in human CRC hepatic metastasis tissue. Scale bar = 100 μm. For a and b, error bars indicate range, box bounds indicate second and third quartiles, center values indicate median, For c and h, error bars indicate s.e.m., center values indicate mean (*P < 0.05, **P < 0.01, ***P < 0.001, n.s. = non-significant, Mann–Whitney U test for (h), and Kruskal–Wallis test with Dunn’s post-test for a–c). EV extracellular vesicles, CM conditioned media, WB immunoblotting

