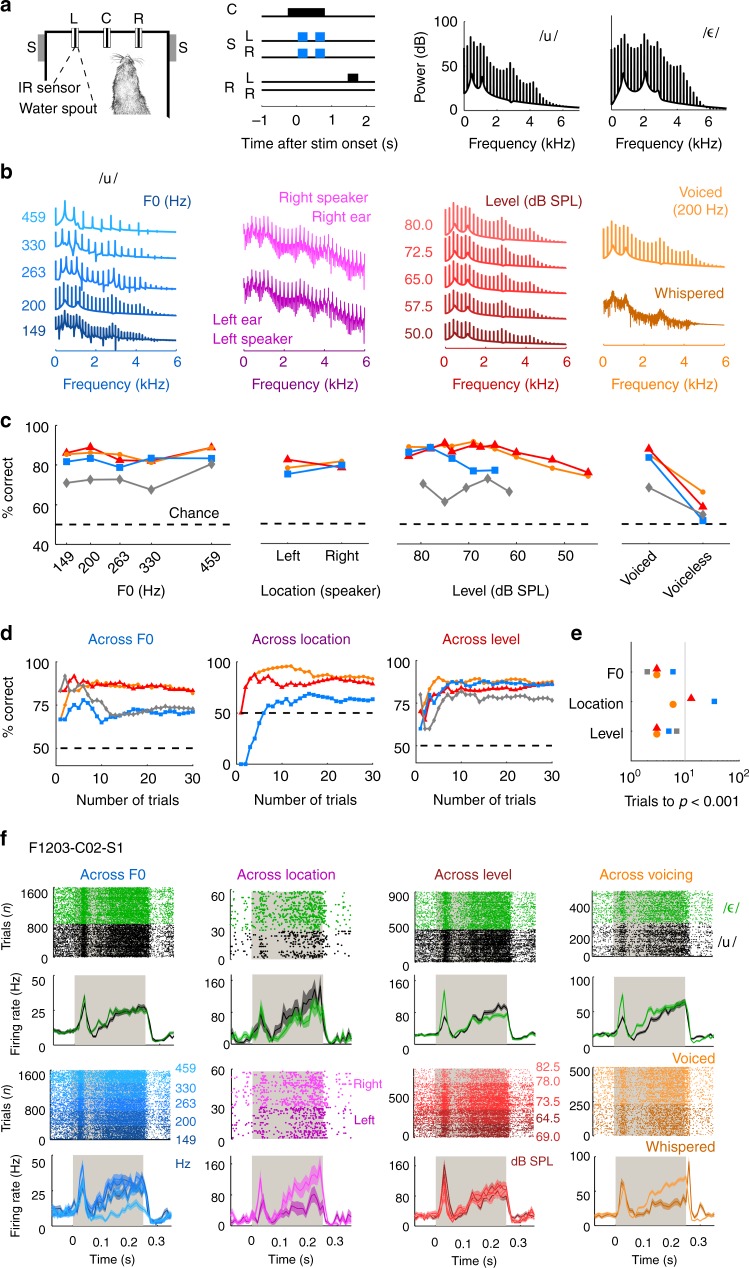
Fig. 1.
Perceptual constancy during vowel discrimination. a Schematic of task design: Animals initiated trials by visiting a central port (C) and waiting for a variable period before stimulus presentation. Speakers (S) presented sounds (two tokens of the same vowel; blue) to the left and right of the head in all conditions except when sounds varied across location—in which case they were presented from either left (SL) or right (SR) speaker only. Animals responded at the left (RL) or right (RR) port depending on vowel identity. b Spectra for 13 examples of one vowel /u/ with varying F0, location, sound level or voicing. To illustrate the effect of spatial location, the spectra were generated in virtual acoustic space67, although sounds presented experimentally varied in their free-field location. c Behavioral performance when discriminating vowels across F0, location, level and voicing. Data are shown as performance correct across all test sessions, for each subject separately (F1201: orange circles, F1203: red triangles; 1217; blue squares; F1304: gray diamonds). See Supplementary Table 1 for sample sizes. d Performance of subjects as a function of experience. Each line indicates one ferret as in c. Dashed lines for c and d show chance performance (50%). e Number of trials required to detect significant task performance when compared to chance (permutation test, p < 0.001). Symbols show individual ferrets as in c. f Raster and peri-stimulus time histograms (PSTHs) of neural responses of one multi-unit to vowels (/u/: black; /ε/: green) across variation in F0 (blue), location (magneta), level (red), and voicing (orange). Data plotted during presentation of the first sound token (gray bar) by vowel identity and by each orthogonal variable. PSTHs show mean ± s.e.m. firing rate across trials

