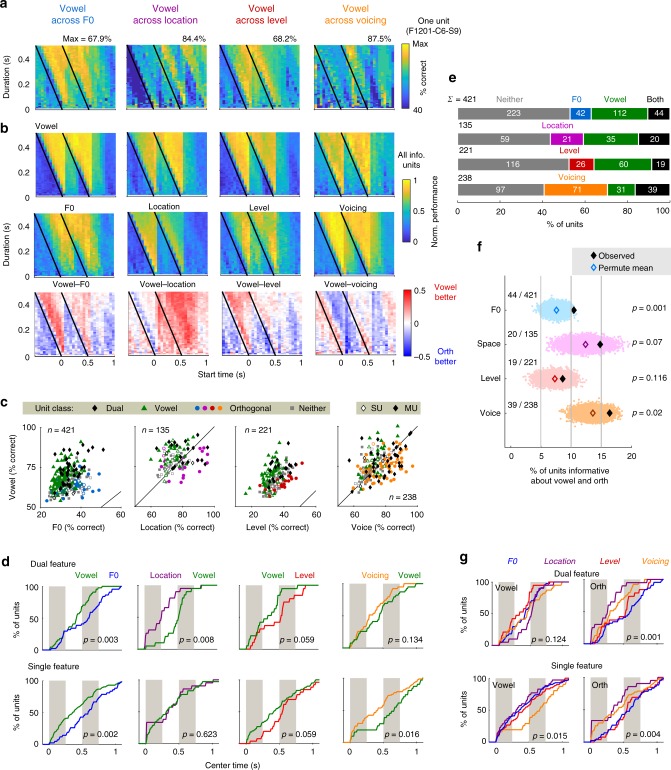
Fig. 2.
Neural responses and decoding acoustic features. a Performance decoding vowel identity for one unit, for all time windows (defined by start time and window duration). Black line indicates stimulus onset. b Mean performance decoding vowel identity and orthogonal features for all units that were informative about vowel and/or orthogonal feature. Bottom: Difference in performance between vowel and orthogonal feature, illustrating consistent differences in timing of information about vowel and orthogonal features. c Decoding performance when reconstructing vowel and orthogonal values from single trial responses of individual units. Markers show best decoding performance of each unit, with unit classification shown as: informative about vowel only (green triangles), orthogonal only (circles), vowel and orthogonal (black diamonds) or neither (gray squares). Single/multi-unit data shown by unfilled/filled markers. Chance performance for vowel, location and voicing was 50% and 20% for F0 and sound level. d Cumulative distribution functions (CDFs) showing center times (start time + duration/2) for best performance of each unit when decoding vowel (green) or orthogonal variables (F0: blue; Location: purple; Level: red; Voicing: orange). Units are shown separately by classification as dual feature units (informative about vowel and orthogonal values), or single-feature units (informative about only vowel or orthogonal values). Gray bars represent stimulus duration. Values (p) indicate comparison of median center time between decoding of vowel and orthogonal values (dual feature units: sign-rank test; single-feature units: rank-sum test). e Number of units informative about vowel/orthogonal values when considering responses across all data. f Permutation test comparing the number of units informative about both vowel and orthogonal features observed (black diamonds) vs. chance (unfilled diamonds indicate mean shuffled performance; scatter plots show random performance across 104 iterations after shuffling unit identity). Values (p) show the proportion of permutated values above the observed number of units. g CDFs for decoding vowel across each orthogonal variable (Vowel) and orthogonal values across vowels (Orth). Data are the same as in d but replotted (and recolored for Vowel) by orthogonal dimensions (F0: blue; Location: purple; Level: red; Voicing: orange). Values (p) show results from Kruskal–Wallis test

