Fig. 3.
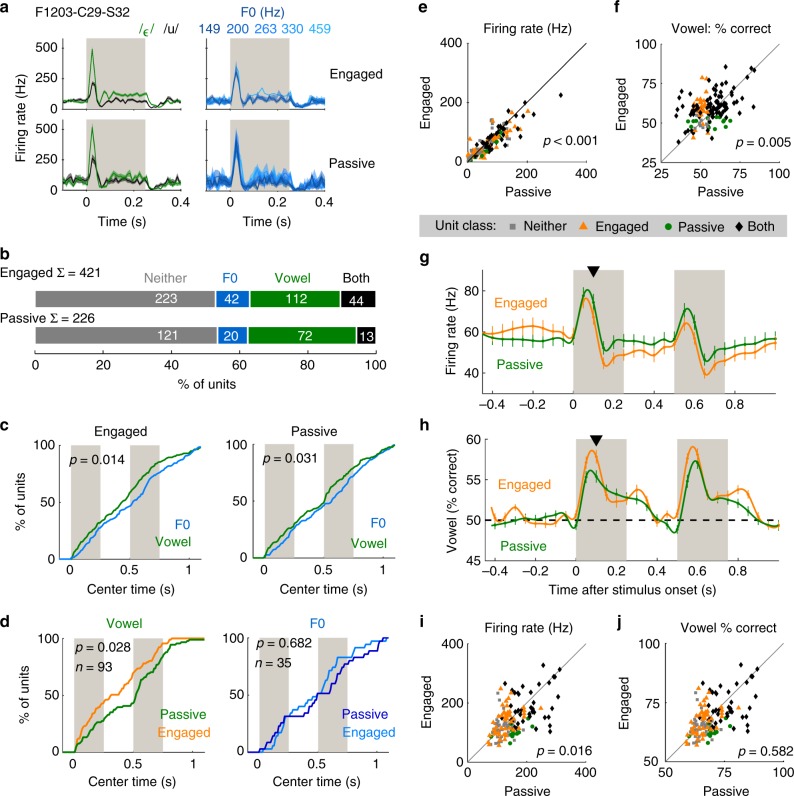
Modulation of auditory processing by task engagement. a Example unit responses recorded during task engagement and passive listening to vowels (/u/: black; /ε/: green) varying in F0 (blue). Data are shown as mean ± s.e.m. firing rates across trials (sample sizes given in Supplementary Table 6). b Proportion of units informative about vowel identity and/or F0. Σ shows sample size; note that not all units recorded during passive listening were recorded during task engagement. c Cumulative density functions (CDF) showing the distribution of decoding time windows giving best performance when decoding vowel (green) and F0 (blue). Data are shown for all units that were informative about vowel and/or F0 in passive or engaged conditions. Values (p) indicate comparison of median center time between decoding of vowel and F0 (rank-sum test). d CDFs showing center time of windows giving best decoding performance in engaged and passive conditions. Data are shown for units informative about vowel (left, engaged: orange; passive: green) or F0 (right, engaged: light blue; passive: dark blue) during task engagement. Values (p) indicate comparison of median center time between engaged and passive conditions (sign-rank test). e–f Paired comparison of mean firing rate (e) and decoding performance (f) in the 100 ms after stimulus presentation for units recorded during engaged and passive conditions (n = 154). Markers show individual units, labeled by classification as informative about vowel identity in engaged and passive (black diamonds), engaged only (orange triangles), passive only (green circles) or neither condition (gray squares) when decoded using optimized time windows. Values (p) indicate comparisons between engaged and passive conditions (sign-rank test). g, h Paired comparison of firing rate and decoding performance in roving 100 ms windows. Data is shown as mean ± s.e.m. across units (n = 154) at 50 ms intervals (spline interpolated across means). Black triangles indicate comparison shown in e and f. i, j Firing rate (i) and decoding performance (j) using optimized time windows (optimized independently in passive and engaged conditions). Values (p) indicate comparisons between engaged and passive conditions for all units (sign-rank test). Markers shown as in e

