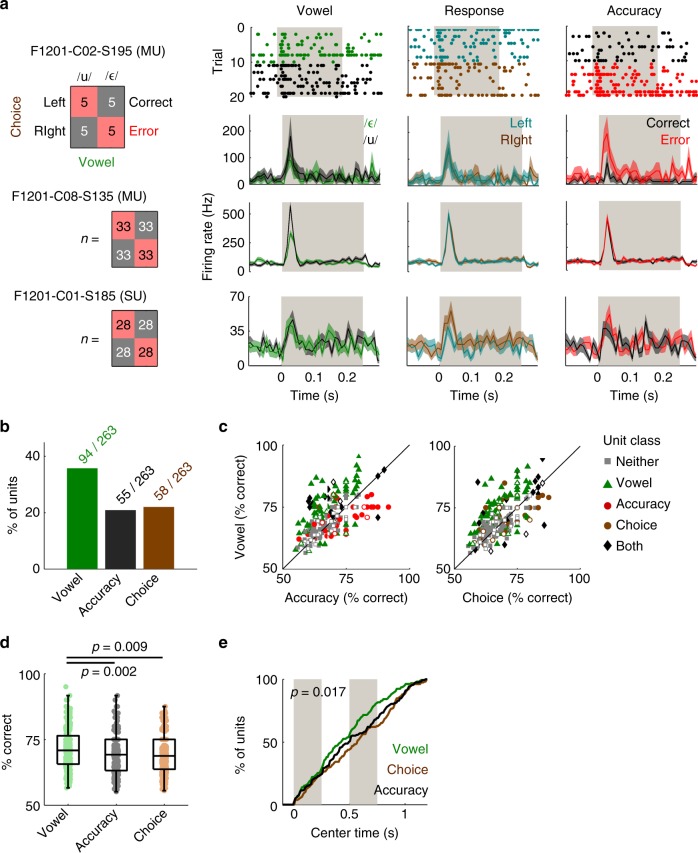
Fig. 4.
Auditory cortical neurons encode sound, choice and accuracy. a Analysis design for matching equal numbers of responses to each vowel (/u/: black; /ε/: green), behavioral choice (left: cyan; right: brown) and trial outcome (correct: black; error: red). Data shown as raster plots of spike times on each trial for one unit and PSTHs representing mean ± s.e.m. firing rate across trials for three units (two multi-units [MU] and one single unit [SU]). Gray bars show the first stimulus token. Trial contingency (i.e., respond left for /ε/) shown as an example on which one ferret was trained (F1217). b Percentage of units informative about sound, choice and/or accuracy in matched data. c Performance decoding sound, choice, and accuracy across all units. Markers show individual units labeled by classification as informative about vowel only (green triangles), accuracy only (red circles), choice only (brown circles), no variable (neither: gray squares) or multiple variables (both: black diamonds). The terms neither and both refer to the dimensions shown within each scatter plot (e.g., about both vowel and choice) rather than across plots. Single/multi-unit data shown by unfilled/filled markers. d Comparison of performance decoding sound, choice and accuracy; boxplots show median, interquartile range (box) and 99.3% intervals (whiskers). Values (p) show significant Tukey–Kramer corrected pairwise comparisons following Kruskal–Wallis test. e Cumulative distributions showing center times for best performance when decoding vowel (green), choice (brown) and accuracy (black). Gray bars represent the duration of the each token within the stimulus. Data shown for all units that were informative about one or more variables. Value (p) shows significant difference in time of decoding identity, choice and accuracy (Kruskal–Wallis test)

