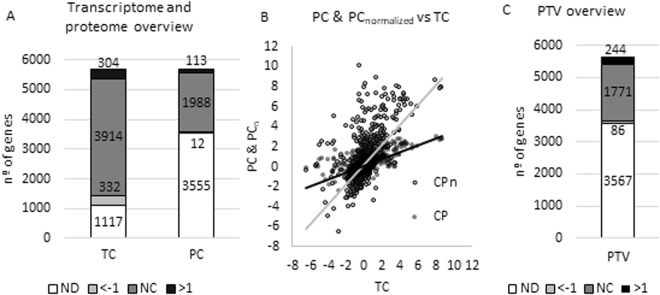
Figure 1.
Global analysis of the post-transcriptional changes associated to the inactivation of Crc. (A) Detected genes. Number of genes whose transcripts or proteins were detected in the transcriptome and proteome analysis. The transcripts/proteins were classified depending on their changes in the level of expression between the ∆crc mutant and the wild-type strain. Black, transcripts/proteins presenting an increasing expression in the ∆crc mutant as compared with the wild type strain (log2 fold change >1). Pale grey transcripts/proteins presenting a lower expression in the ∆crc mutant as compared with the wild type strain (log2 fold change <−1). Dark grey transcripts/proteins not showing relevant changes in their expression levels (log2 fold change between −1 and 1, NC). ND No detected. (B) PC & PCnormalized vs TC. All the PC values of each of the genes were plotted against the TC values and the slope is represented. The new PCnormalized values present a slope = 1 when represented against TC. (C) Genes with assigned PTV. Number of genes that have an assigned PTV. Black, genes presenting an increasing PTV in the ∆crc mutant as compared with the wild type strain (log2 fold change >1). Pale grey genes presenting a lower PTV in the ∆crc mutant as compared with the wild type strain (log2 fold change <−1). Dark grey genes not showing relevant changes in their PTVs (log2 fold change between −1 and 1, NC). ND No detected.

