Figure 5.
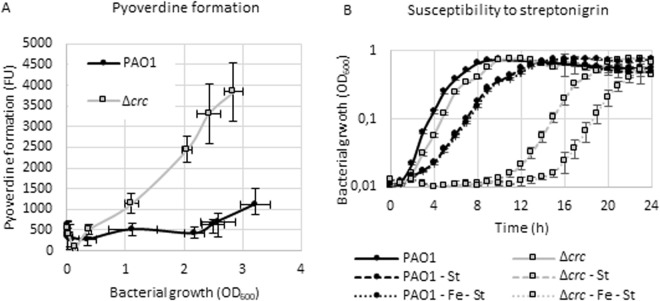
Effect of Crc on iron uptake. (A) Pyoverdine formation. Pyoverdine formation by the wild type strain and the Δcrc mutant was measured during growth in LB medium. The fluorescence was measured according to reference60 and the values are plotted against the bacterial growth. Error bars represent the standard deviation of three biological replicates. (FU: fluorescence units). (B) Susceptibility to streptonigrin. The wild type strain and the Δcrc mutant strain were grown in LB medium, LB supplemented with 5 µg/ml of streptonigrin (LB - St) and LB supplemented with 5 µg/ml of streptonigrin and 1 mM of FeCl3. (LB-Fe-St). Bacterial growth was measured recording the OD600 every 10 min, although average values corresponding to three biological replicates each hour are represented in the graph. Error bars represent the standard deviation.

