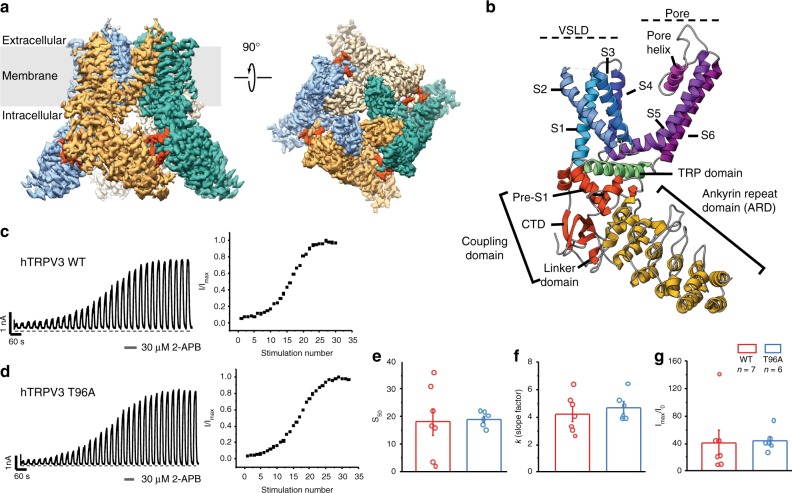
Fig. 1.
Structural and functional characterization of the human TRPV3. a 3D cryo-EM reconstruction of the apo human TRPV3 tetramer, colored by protomer. The C-terminal domain is shown in red. b Overview of the structural elements within a single protomer of the TRPV3 channel: Ankyrin repeat domain (ARD) is shown in yellow; Coupling domain (CD), consisting of linker domain, pre-S1 and the C-terminal domain, is shown in red; Voltage sensing-like domain (VSLD), consisting of helices S1−S4, is shown in blue, the pore domain, consisting of helices S5−S6 and the pore helix, is colored in purple; the TRP domain is shown in green. c, d Functional characterization of the TRPV3 wild-type (c) and T96A mutant (d) channels. Representative whole-cell current traces recorded at +60 mV from TRPV3 wild-type and T96A channels evoked by repeated application of 30 µM 2-APB for 15 s followed by complete washout (left) and corresponding time course of sensitization from the depicted recording (right) (TRPV3WT: n = 7 biologically independent experiments; TRPV3 T96A: n = 6 biologically independent experiments). e, f The half-maximal stimulation number (S50) (e) and rate of change (k) (f) of sensitization were calculated as the mean values obtained from fits of time course of sensitization plots from individual recordings (TRPV3WT: n = 7 biologically independent experiments; TRPV3 T96A: n = 6 biologically independent experiments) with standard two-state Boltzmann equation (see Methods). The extent of sensitization (g) was characterized by the relative increase in the current response to 2-APB during the first (I0) and maximum current (Imax) stimulation (Imax/I0) and calculated as the mean from each biologically independent experiment. No significant differences (NS) in the S50 (P = 0.86), k (P = 0.46), and Imax/I0 (P = 0.90) was determined between TRPV3WT and TRPV3 T96A (two-tailed Student’s t test, P > 0.05). Confidence intervals (95%): −14.2 (low)/12.2 (high) for S50, −2.54 (low)/1.52(high) for k, −55.1 (low)/49.8 (high) for Imax/I0. Bar graphs and error bars denote mean ± s.e.m. The source data underlying Fig. 1e–g are provided as a Source Data file

