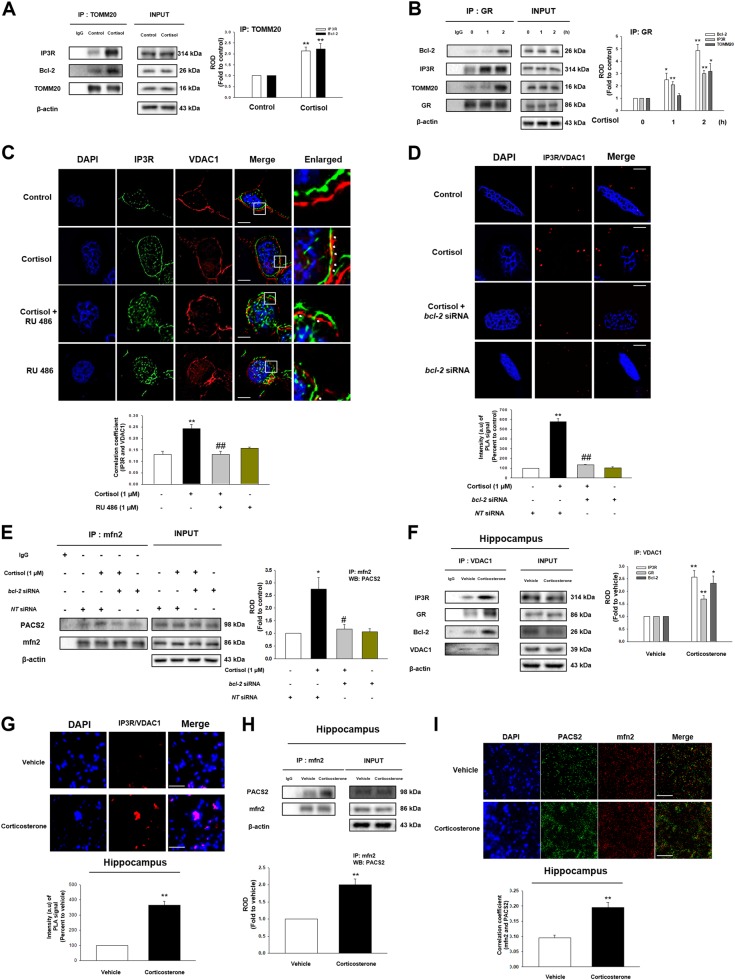
Fig. 3. The effect of cortisol on ER-mitochondria contact via interaction between GR and Bcl-2.
a The cells were incubated with cortisol (1 μM) for 2 h. TOMM20 was co-immunoprecipitated with anti-IP3R and -Bcl-2 antibodies (the left side). Expression of IP3R, Bcl-2, TOMM20, and β-actin in total cell lysates is shown in the right side. ** indicates p < 0.01 vs. control. n = 4. b The cells were incubated with cortisol (1 μM) for various time. GR was co-immunoprecipitated with anti-Bcl-2, IP3R, and TOMM20 antibodies (the left side). Expression of Bcl-2, IP3R, TOMM20, GR, and β-actin in total cell lysates is shown in the right side. *, ** indicates p < 0.05, p < 0.01 vs. control, respectively. n = 4. (c) The cells were incubated with RU 486 (1 μM) for 30 min before cortisol treatment (1 μM) for 2 h. Co-localization of IP3R (green) and VDAC1 (red) was visualized with SRRF imaging system. DAPI was used for nuclear counterstaining (blue). ** indicates p < 0.01 vs. control and ## indicates p < 0.01 vs. cortisol alone. Scale bars represent 20 μm (magnification, ×900). n = 5. d Knockdown of bcl-2 was done using siRNA transfection for 24 h and then cells were treated with cortisol (1 μM) during 2 h. The cells underwent proximal ligation assay (PLA) and the red fluorescence indicates the co-localization between IP3R and VDAC1. DAPI was used for nuclear counterstaining (blue). Data are acquired by SRRF imaging system. ** indicates p < 0.01 vs. control and ## indicates p < 0.01 vs. cortisol alone. Scale bars represent 20 μm (magnification, ×900). n = 4. (e) Knockdown of bcl-2 was done using siRNA transfection for 24 h and then cells were treated with cortisol (1 μM) during 2 h. mfn2 was co-immunoprecipitated with an anti-PACS2 antibody (the left side). Expression of PACS2, mfn2, and β-actin in total cell lysates is shown in the right side. * indicates p < 0.05 vs. control and # indicates p < 0.05 vs. cortisol alone. n = 4. f The hippocampus of mice exposed to vehicle or corticosterone (10 mg/kg) for 2 h was collected and lysed. VDAC1 was co-immunoprecipitated with anti-IP3R, GR, and Bcl-2 antibodies (the left side). Expression of IP3R, GR, Bcl-2, VDAC1, and β-actin in total cell lysates is shown in the right side. *, ** indicates p < 0.05, p < 0.01 vs. vehicle, respectively. n = 5. g Slide samples for IHC of mice with vehicle or corticosterone (10 mg/kg) for 2 h underwent PLA and the red fluorescence indicates the co-localization between IP3R and VDAC1. DAPI was used for nuclear counterstaining (blue). ** indicates p < 0.01 vs. vehicle. Scale bars, 200 μm (magnification, ×200). n = 5. (h) The hippocampus of mice exposed to vehicle or corticosterone (10 mg/kg) for 2 h was collected and lysed. mfn2 was co-immunoprecipitated with an anti-PACS2 antibody (the left side). Expression of PACS2, mfn2, and β-actin in total cell lysates is shown in the right side. ** indicates p < 0.01 vs. vehicle. n = 5. i Slide samples for IHC of mice with vehicle or corticosterone (10 mg/kg) for 2 h were immunostained with PACS2 (green) and mfn2 (red). DAPI was used for nuclear counterstaining (blue). Scale bars, 200 μm (magnification, ×200). ** indicates p < 0.01 vs. vehicle. n = 5. All blot and immunofluorescence images are representative. Quantative data are presented as a mean ± S.E.M.

