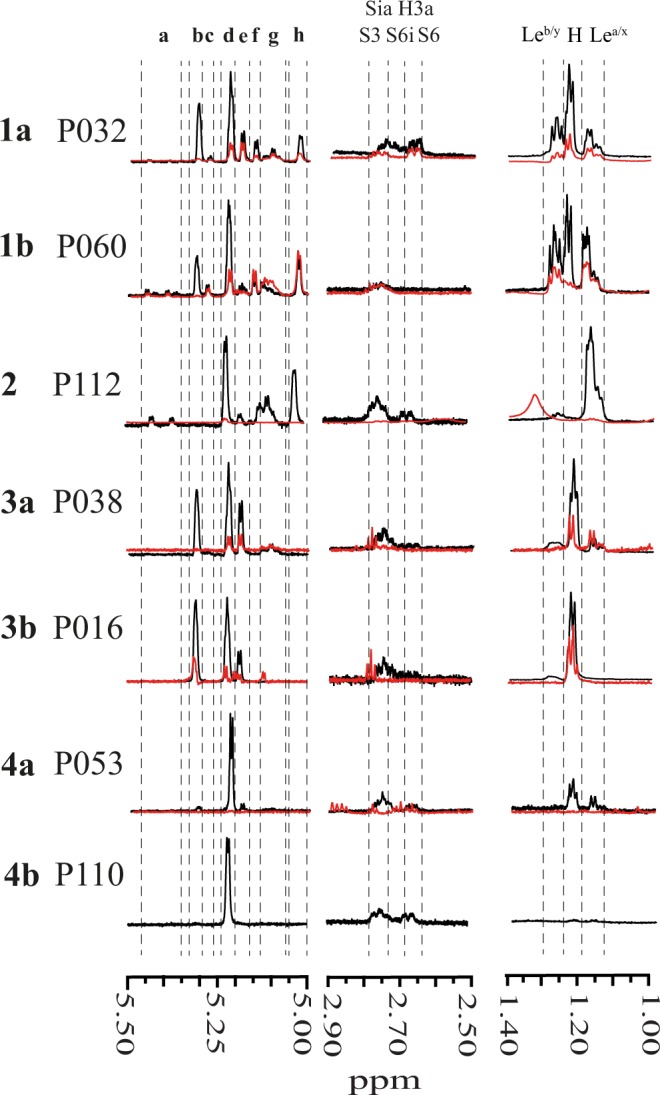
Figure 2.

Example 1D 1H NMR spectra for milk groups 1a, 1b, 2, 3a, 3b, 4a and 4b. Black line is the spectrum for mothers’ milk and the red line (where present) is for the corresponding infant faeces sample. Structural-reporter-group signals are indicated; anomeric region δ5.00–5.50: (a) Fuc(α1–3)- H-1 in pseudo-Lex (3-FL) and pseudo-Ley (DF-L) epitopes, (b) Fuc(α1–2)- H-1 in 2′-FL, (c) Fuc(α1–2)- H-1 in Ley epitopes, (d) α-D-Glcp H-1, (e) Fuc(α1–2)- H-1 in H-antigen epitopes and α-D-Glcp H-1 in 3-FL and DF-L, (f) Fuc(α1–2)- H-1 in Leb epitopes, (g) Fuc(α1–3)- H-1 in Lex and Ley epitopes (h). Fuc(α1–4)- in Lea and Leb epitopes, Neu5Ac region δ2.50–2.90 ppm: S3 Neu5Ac(α2–3)- H-3e, S6 Neu5Ac(α2–6)-Gal H-3e, and S6i Neu5Ac(α2–6)-GlcNAc H-3e; Fuc CH3 region δ 1.00–1.40: Leb/y CH3 signals of Fuc residues in Leb and Ley epitopes, H, CH3 signals of Fuc residues in H-antigen epitopes and Lea/x, CH3 signals of Fuc residues in Lea and Lex epitopes.
