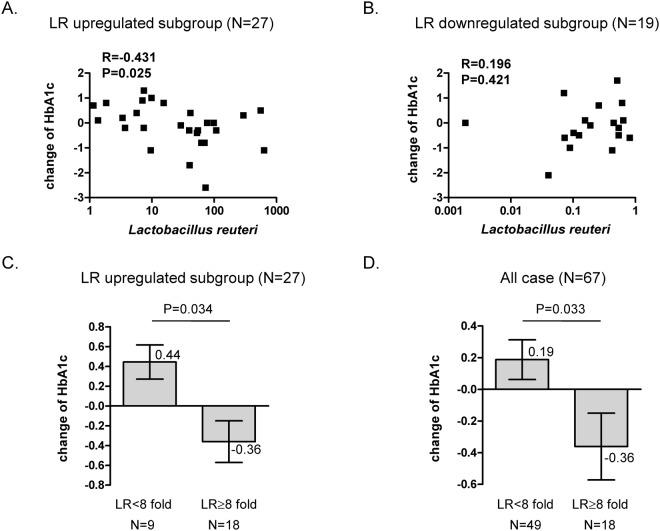
Figure 4.
The association between fecal L. reuteri level and the changes of HbA1c. The correlation between L. reuteri level and the change of HbA1c in participants with L. reuteri level up-regulated group (LR change>1) (A) or down-regulated group (LR change≤1) (B). The statistical analysis was calculated with Spearman’s rho correlation. (C,D) Analysis of HbA1c changes between participants with different level of upregulated L. reuteri (C), n = 27) or all cases involving in this trial (D), n = 67).

