
Figure 2. Contractile responses to stimulation of inhibitory motor neurons in the monkey IAS and rectum.
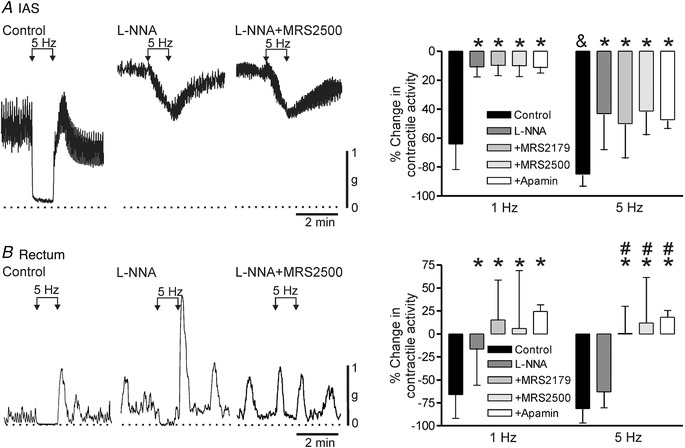
Sample traces show responses to 5 Hz EFS in the IAS (A) and rectum (B) under control conditions (left trace), in the presence of 100 μM l‐NNA (middle trace) and with combined l‐NNA plus 1 μM MRS2500 (right trace). l‐NNA and MRS2500 were added at least 20 min before EFS. The dotted lines indicate zero active contraction. A (right), bar graph plotting summary data for responses to 1 and 5 Hz EFS in IAS under control conditions (1 Hz, n = 15; 5 Hz, n = 15) in the presence of l‐NNA (1 Hz, n = 9; 5 Hz, n = 9) and with combined l‐NNA plus 10 μM MRS2179 (1 Hz, n = 7; 5 Hz, n = 7), 1 μM MRS2500 (1 Hz, n = 7; 5 Hz, n = 9) or apamin (1 Hz, n = 8; 5 Hz, n = 8). The response to 5 Hz EFS was significantly (& P < 0.05) greater than to 1 Hz EFS. l‐NNA significantly (* P < 0.05) reduced responses to 1 and 5 Hz EFS in the IAS. Responses in the presence of l‐NNA in combination with either MRS2179, MRS2500 or apamin were also significantly less than control (* P < 0.05) but not different from one another (P > 0.05). B (right), bar graph plotting summary data for responses to 1 and 5 Hz EFS in rectum under control conditions (1 Hz, n = 25; 5 Hz, n = 24) in the presence of l‐NNA (1 Hz, n = 22; 5 Hz, n = 24), with combined l‐NNA plus 10 μM MRS2179 (1 Hz, n = 10; 5 Hz, n = 9), 1 μM MRS2500 (1 Hz, n = 12; 5 Hz, n = 16) or apamin (1 Hz, n = 6; 5 Hz, n = 6). l‐NNA significantly (* P < 0.05) reduced the response to 1 Hz but not 5 Hz EFS in rectum. No further change in the 1 Hz response was noted when l‐NNA was combined with either MRS2179, MRS2500 or apamin. In contrast, with 5 Hz EFS the response with combined antagonists was significantly less than either control (* P < 0.05) or l‐NNA alone (# P < 0.05). Shown are mean values ± SD.