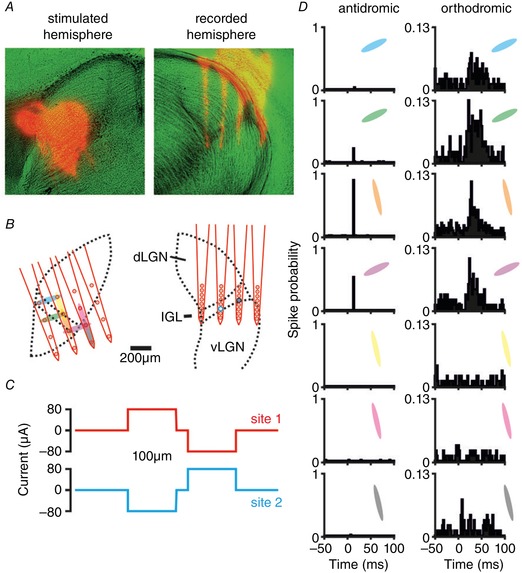
Figure 1. Identification of commissurally connected geniculate neurons.

A, anatomical images showing DiI‐labelled probe tracks (red) and light microscopy (pseudocoloured green). B, schematic representation of reconstructed stimulus (left) and recording (right) site locations relative to the LGN boundaries. In this example the stimulating probe was placed ∼250 μm rostral relative to the recording probe. Shaded ovals (left) indicate pairs of electrode sites used for current delivery and larger circles (right) indicate locations of two isolated neurons shown in panel D. C, current injection pattern used for these experiments; horizontally or vertically neighbouring pairs of sites were used to deliver biphasic dipolar current injection (in this case ±80 μA). D, perievent histograms showing response to electrical stimulation (100 trials) at the sites, and for the units, indicated in B. Visual responses of the orthodromically activated cell (right panel) are shown in Fig. 2 F (middle panel).
