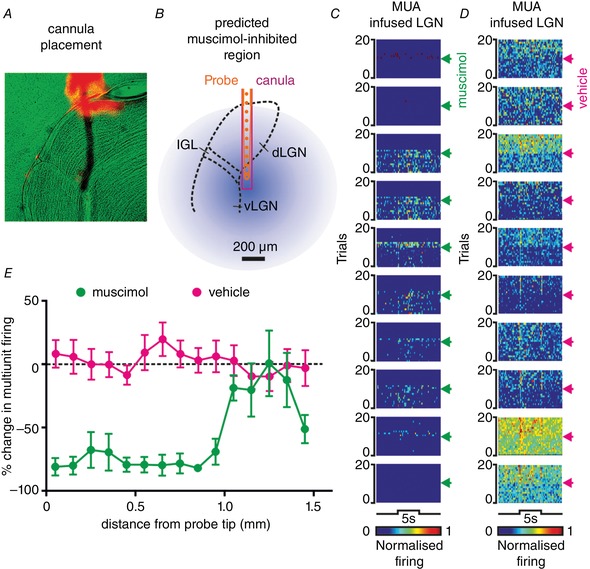
Figure 3. Validation of thalamic inactivation approach.

A, anatomical image showing DiI‐labelled probe track (red) and light microscopy (pseudocoloured green) for a drug‐probe placement within the LGN. B, corresponding schematic representation of recording probe (10 ventral‐most sites of the 16 channel probe), drug cannula and predicted spread of muscimol (based on data in E and assuming symmetrical spread of drug from probe tip). C and D, pseudocoloured rasters showing normalised spike counts for 10 ventral‐most sites across 20 trials of a bright binocular light step (405 nm LED, 5 s, 15.4 log effective photons cm−2 s−1) during which muscimol (C) or vehicle (D) was infused (2 μL at 1 μL min−1; timing indicated by arrowheads). E, mean ± SEM percentage change in multiunit activity (MUA) during the binocular light step following muscimol or vehicle infusion as a function of distance of the recording site from the probe tip (n = 7 muscimol and n = 8 vehicle experiments).
