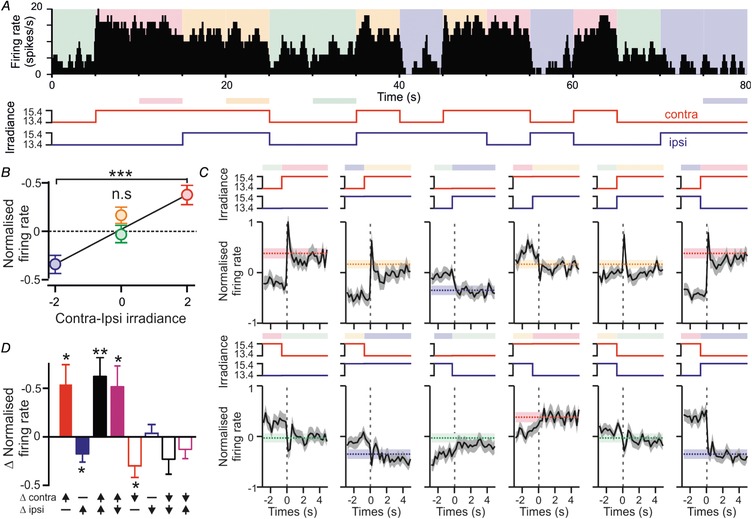
Figure 6. Contralateral‐ON antagonistic cell firing encodes interocular difference in irradiance.

A, firing rate of a contra‐ON/ipsi‐OFF cell across a segment of a randomised binocular luminance protocol, illustrating all possible stimulus transitions. Coloured shading represents the combination of ipsi‐ and contralateral irradiance at each point. Lower panel illustrates changes in irradiance at either eye; shaded bars represent 5 s stimulus blocks where binocular irradiance did not change relative to the previous 5 s. B, mean ± SEM normalised firing activity (relative to mean across whole protocol) for contra‐ON/ipsi‐OFF cells (n = 33) over each of the four stimulus blocks highlighted in A (lower panel) and plotted according the interocular difference in irradiance. C, mean ± SEM normalised firing activity for contra‐ON/ipsi‐OFF cells (as above) over time relative to a change in ipsi‐ and/or contralateral irradiance. Shaded bars represent the expected post‐step firing rate in the absence of visual contrast (mean ± SEM; re‐plotted from B). D, mean ± SEM isolated contrast responses (difference in firing relative to that expected for the irradiance) following changes in ipsi‐ and/or contralateral irradiance. Data in B and D analysed by one‐way RM‐ANOVA with Sidak's post hoc test (B) or one‐sample t test (D); n.s, P > 0.05; * P < 0.05, ** P < 0.01, *** P < 0.001.
