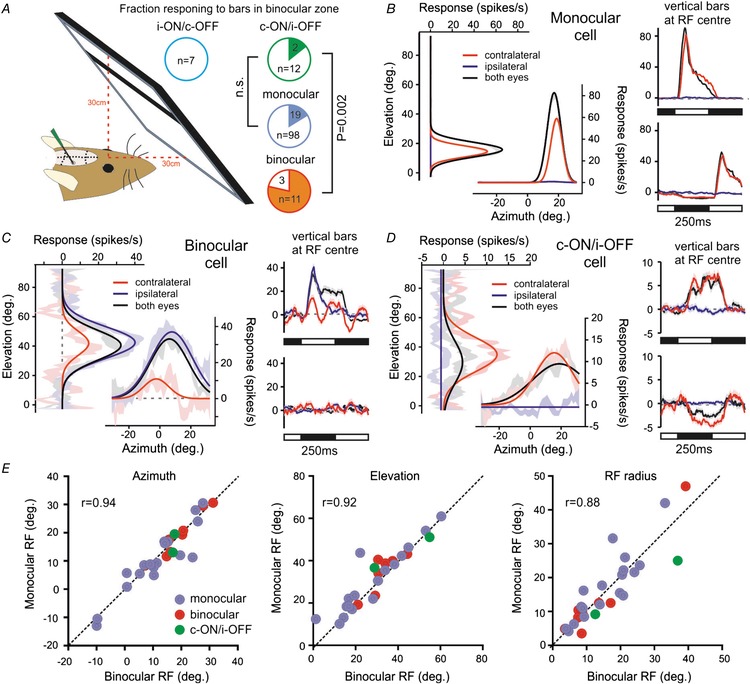
Figure 8. Antagonistic cell receptive fields do not preferentially localise to binocular visual space.

A, schematic representation of visual display placement (occupying ∼70% of binocular visual space) and the proportion of each class of IGL/vLGN neurons responding to the appearance of horizontal and vertical bars (filled regions in pie charts). Data were analysed by Fisher's exact test; n.s., P > 0.05. B–D, responses of individual monocular (B), binocular (C), and contra‐ON/ipsi‐OFF antagonistic cells (D) to bar stimuli presented to one or both eyes. In all cases, left panels show mean ± SEM difference in response to white vs. black horizontal or vertical bars as a function of bar position (in degrees relative to midpoint between the eyes). Continuous lines show Gaussian fits used to estimate RF position and diameter. Right panels show mean ± SEM change in firing evoked by vertical white (top) or black (bottom) bars appearing at the RF centre (data for horizontal bars omitted for clarity). E, relationship between RF parameters obtained for cells that responded under both monocular vs. binocular viewing conditions (n = 2 contra‐ON/ipsi‐OFF, 18 monocular and 8 binocular cells).
