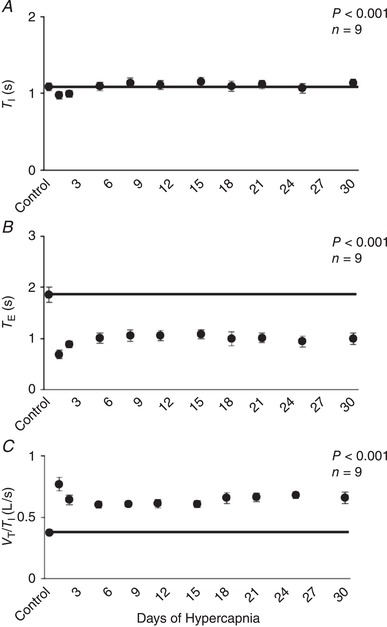
Figure 2.

Temporal pattern of inspiratory time (T I), expiratory time (T E) and ventilatory drive (V T/T I) during 30 days of exposure to 6% inspired CO2
There was a small but significant reduction in T I during initial exposure to 6% InCO2, followed by a recovery to control during the first week of hypercapnia, with minimal changes thereafter (A). In contrast, T E remained significantly below control during 30 days of chronic hypercapnia (B), and there was a sustained elevation in ventilatory drive (C). The solid lines provide a reference to control values obtained at room air prior to 6% InCO2 exposure. P values shown were derived from a one‐way repeated measures ANOVA (time as factor).
