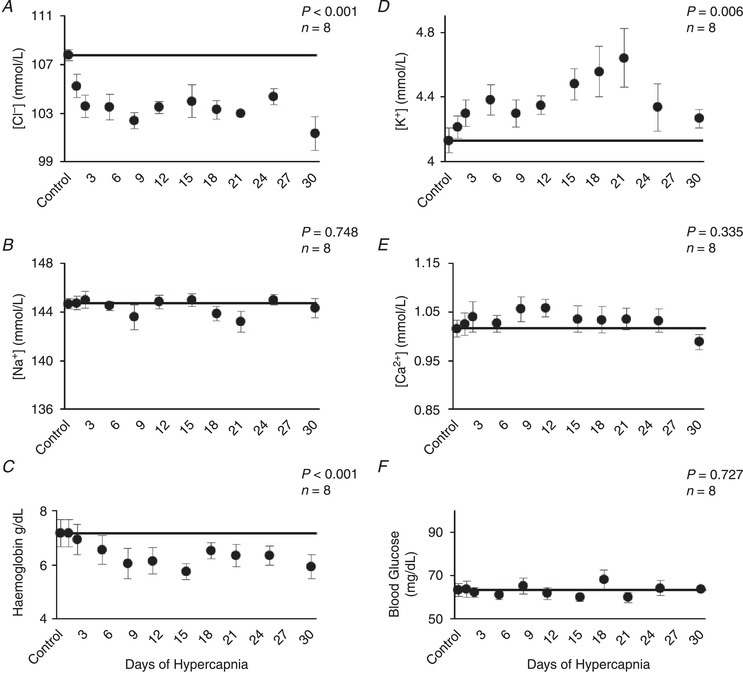
Figure 4. Arterial blood electrolyte adaptations during 30 days of chronic exposure to 6% InCO2 .

Arterial chloride decreased ∼5 mmol/L during the first week of chronic hypercapnia (A), coincident with increases in arterial [HCO3 −] (Figure 3). Thereafter, arterial chloride remained below control for the duration of chronic hypercapnia. Arterial potassium showed a small but significant increase during the first week of hypercapnia (D), that was maintained throughout hypercapnic exposure. Haemoglobin decreased ∼1 g/dL during the first week of hypercapnia and remained below control (C). Minimal changes were noted in arterial sodium (B), calcium (E) and blood glucose (F), during chronic hypercapnia. The solid lines provide a reference to control values obtained at room air prior to 6% InCO2 exposure. P values shown were derived from a one‐way repeated measures ANOVA (time as factor).
