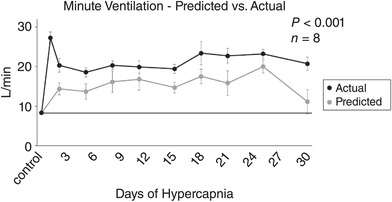
Figure 10. Actual vs. predicted minute ventilation during 30 days of chronic exposure to 6% InCO2 .

Minute ventilation of the goats during 30 days of chronic hypercapnia remained significantly above the level of ventilation that would be predicted from the steady‐state level of arterial [H+] and the results from the acute CO2/[H+] chemoreflex for each day of chronic hypercapnia. The sustained elevation of measured ventilation above the predicted values represents a disconnect between steady‐state ventilation and the acute chemoreflex during chronic hypercapnia, and a shift in the ventilatory set‐point to an elevated level. The solid line provides a reference to control values obtained prior to 6% InCO2 exposure. The P value shown was derived from a two‐way ANOVA (predicted vs. actual ventilation and time as factors).
