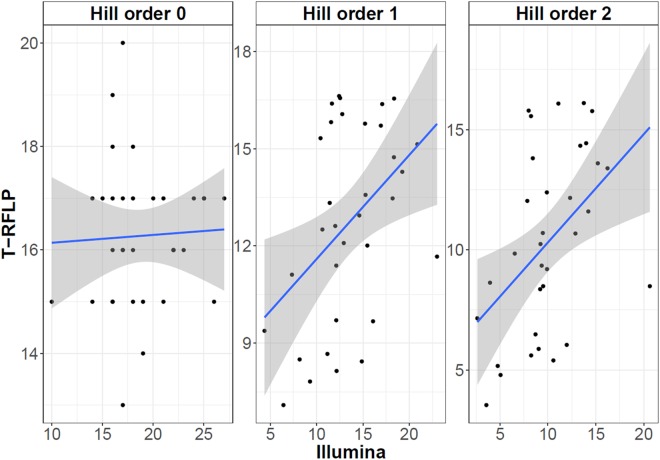
Figure 1.
Spearman’s Rank correlation for the H0, H1 and H2 Hill numbers. The richness (H0), exponential of the Shannon diversity index (H1) and the Inverse Simpson index (H2) are included. Correlation between the Illumina and TRFLP data for H0 (P = 0.87) was not significant, yet, for H1 (ρ = 0.37 & P = 0.033) and H2 (ρ = 0.42 & P = 0.015) a significant positive correlation was observed. The grey zone represents the 95% confidence interval.

