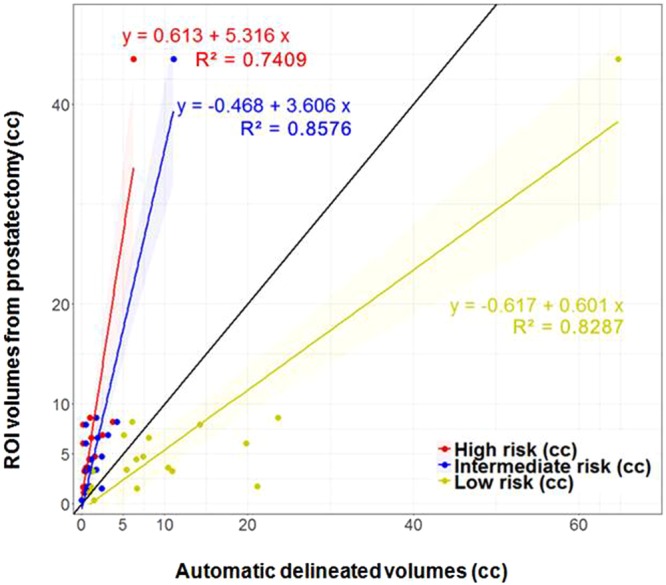
Figure 5.

Correlation of prostatectomy ROIs and automatically delineated volumes, based on ADC thresholds. The black line is the unity line. The high and intermediate risk volumes are smaller than the prostatectomy ROIs. This is consistent with the notion that they are related to the more aggressive habitats of the tumor. The low volumes, by design, are supposed to map all tumor areas, including GS6. These volumes, however, appear to be larger by a factor of 1.4. If tissue-shrinkage factor (between 1.22 and 1.5) is considered, the unit line and regression line of the low risk volumes become co-linear.
