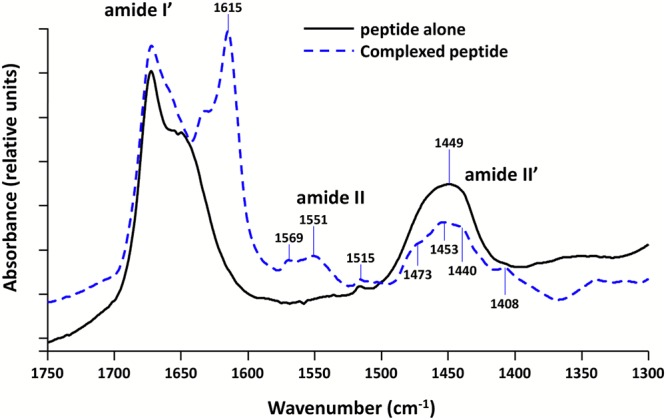
Figure 2.

FTIR spectra of Hfq-CTR in the presence or absence of DNA. D2O buffered samples have been used to avoid the spectral overlaps between Amide I and water bands. Solid black line: peptide alone. Dashed blue line: difference spectrum obtained by subtracting the (dA:dT)59 contribution from the complex spectrum. We clearly observe in the Amide I’ band a contribution at 1615 cm−1, indicative of the formation of the amyloid structure in the presence of DNA. Note in the complex the presence of both Amide II and II′ bands, due to N\H and N\D in-plane bending of the peptidic groups, respectively. Strikingly, the Amide II is present only in the complex, indicating that hydrogens may be entrapped inside the complex and cannot exchange with deuterium83.
