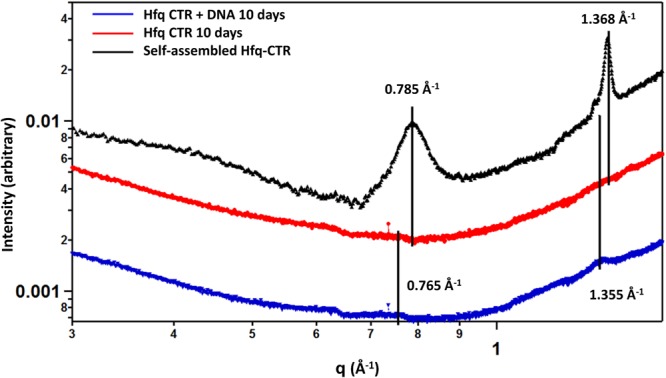
Figure 3.

SAXS curves of Hfq-CTR in the presence or absence of DNA. β-Sheet peaks corresponding to a cross-β structure are clearly observed for Hfq-CTR in the presence of DNA (incubated 10 days, blue curve) and for Hfq-CTR alone incubated for 6 weeks at 20 mg/mL (higher time and concentration are used to ensure the formation of amyloid fibrils in the absence of cofactor, black curve). But no β-Sheet peak is observed for Hfq-CTR alone after 10 days (red curve). Peaks corresponding to cross-β structure can be seen at 0.765 and 1.355 Å−1 for complexed Hfq-CTR, and 0.785 and 1.368 Å−1 for non-complexed Hfq-CTR, corresponding to inter-sheet and inter-strand distances (d) of 8.21 and 4.63 and 8.00 Å and 4.59 Å, respectively (d(Å) = 2π/q(Å−1)).
