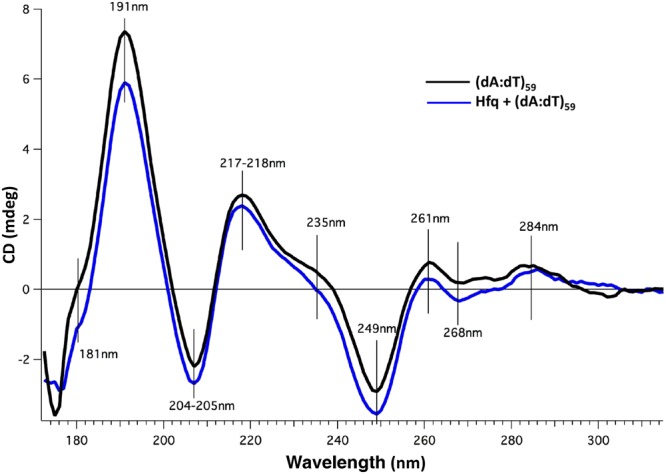
Figure 6.

SRCD spectra of DNA interacting with full length Hfq. (dA:dT)59 with Hfq (blue line) or without Hfq (black line). The respective contribution of buffer and protein were subtracted. As shown in Fig. 1, spectral changes indicate that DNA induces a structural change of the protein and conversely. A low Hfq/bp ratio was chosen in order to minimize the signal of the protein sample and to focus on DNA structural change. As previously described49, the spectrum of the (dA:dT)59 duplex contains positive bands at ~217 nm and ~191 nm (with a shoulder at ~181 nm), and a negative band at ~205 nm. Spectral band differences for DNA with and without CTR at 181 and 191 nm (charge transfer and pi-pi*, respectively) correspond to local changes in DNA helix conformation. Further spectral differences include a shoulder at 235 nm and amplitude differences at 249, 261, 268 and 284 nm; the later three positions corresponding to well identified peaks in DNA CD spectroscopy reflecting the base pairing and stacking49,84. Smaller magnitudes reflect a weaker degree of base stacking84. Note that the amplitude differences are not proportional, which indicates that structural changes are occurring upon interaction between DNA and the CTR of Hfq.
