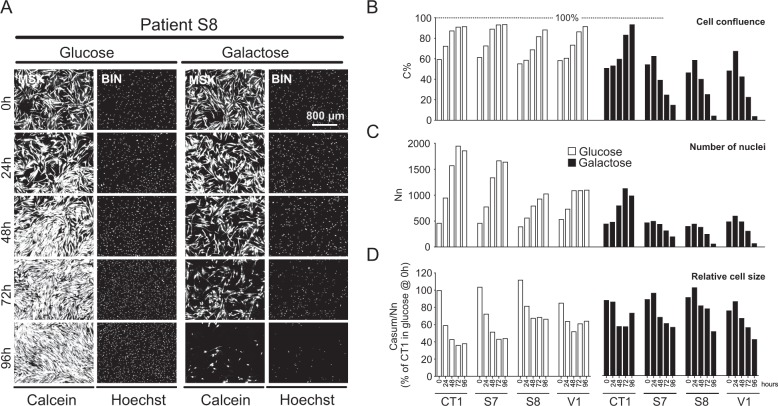
Fig. 1. Galactose specifically reduces the viability of LS fibroblasts in a time-dependent manner.
a Time-dependent effect of glucose and galactose in LS fibroblasts (S8 cells shown as a typical example). The cells were co-stained with Calcein-AM and Hoechst 33258 to visualize the cytosol and nuclei, respectively. Image processing was applied to calculate “masked” (MSK) and black-and-white “binary” (BIN) images (see Results for details). b Time-dependent analysis of control (CT1) and LS cells (S7, S8, V1) cultured in glucose-containing or galactose-containing medium (N = 1, n ≥ 2). The y-axis represents C%, the percentage of total pixels in the BIN image that was Calcein-positive. C% is a measure of cell confluence. c Same as b but now for the number (Nn) of Hoechst-positive objects (nuclei; middle panel), calculated from the Hoechst BIN image. Nn is used as a measure of cell number. d Same as b but now for the total number of Calcein-positive pixels (Casum; a measure of cell area) divided by the number of nuclei (Nn). This reflects the relative size of the cells (expressed as % of CT1 in glucose @ 0 h). Results for the individual cell lines are presented in Fig. S1, S2, S3, S4

