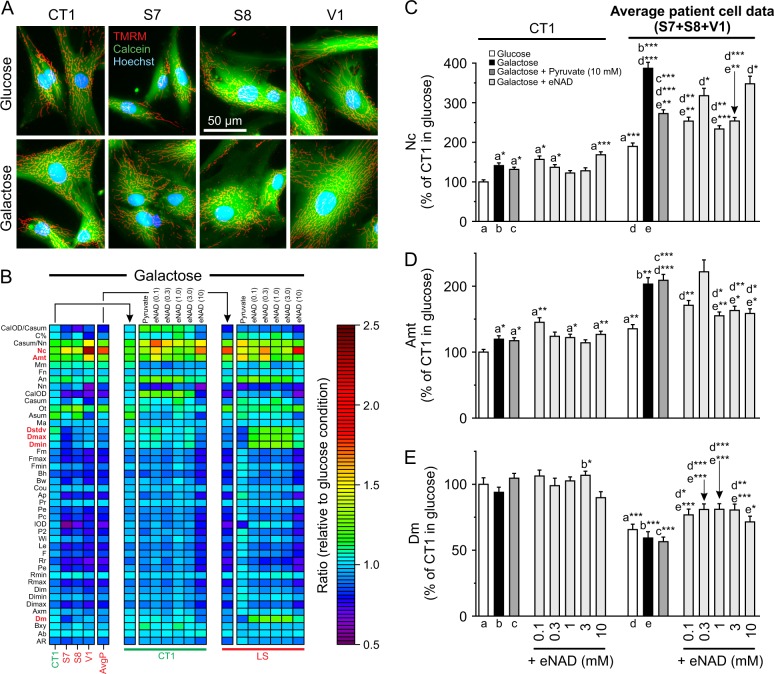
Fig. 5. Effect of galactose, pyruvate and exogenous NAD+ (eNAD) on mitochondrial morphofunction in LS fibroblasts.
CT1 and LS cells (S7, S8, V1) were cultured in glucose or galactose medium for 24 h and analyzed. a Typical microscopy images of cells stained with TMRM (mitochondria), Calcein-AM (cytosol) and Hoechst 33258 (nuclei). b Heatmap displaying the average value of the morphofunctional descriptors (y-axis; normalized on the glucose condition). The left group of panels depict results obtained using the galactose medium (CT1, S7, S8, V1, and average patient data; AvgP).The middle group of panels depict results obtained using the galactose + pyruvate (10 mM) and galactose + eNAD (0.1, 0.3, 1, 3, and 10 mM) medium (CT1 cells). The right group of panels is similar to the middle group of panels but now depicting the average results obtained with LS cells. c Values of Nc, representing the the number of mitochondria per cell. d Values of Amt, representing the total mitochondrial area per cell. e Values of Dm, representing the average mitochondrial TMRM intensity (a measure of the mitochondrial membrane potential Δψ). Statistics: Glucose and galactose conditions (CT1, S7, S8: N = 2, n = 60; V1: N = 1, n = 12). Galactose + pyruvate condition (CT1, S7, S8, V1: N = 1, n = 12). Galactose + eNAD condition (CT1, S7, S8, V1: N = 1, n = 12; all concentrations). Results for the individual cell lines and detailed data analysis are presented in Fig. S10, S11

