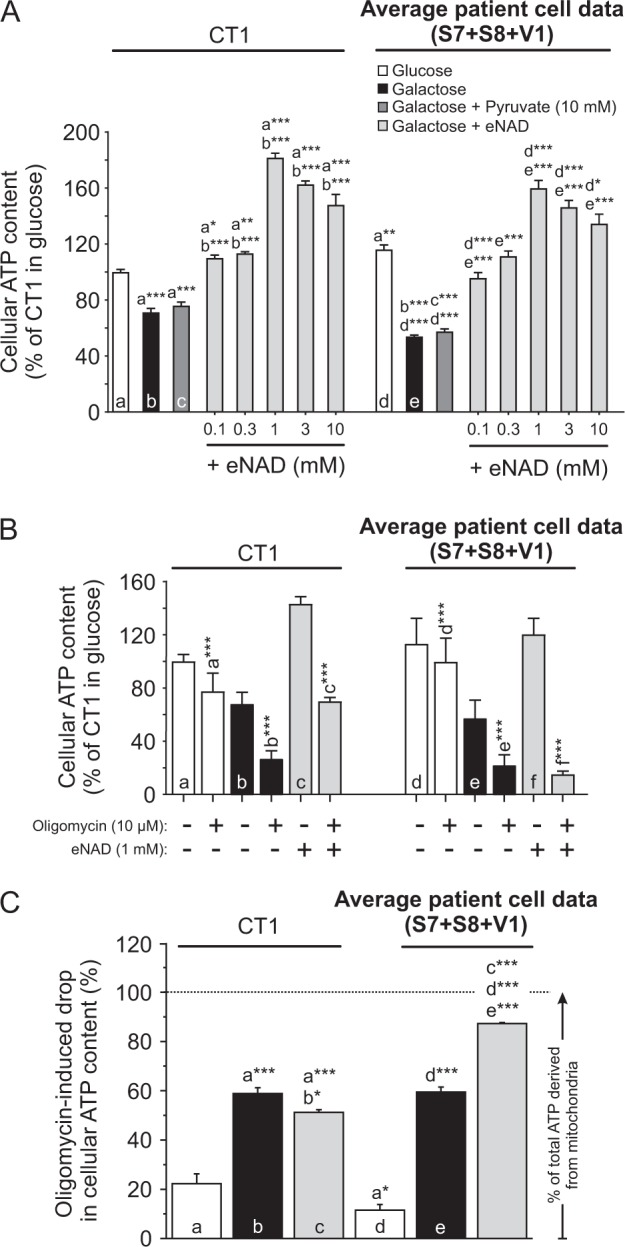
Fig. 7. Effect of galactose, pyruvate and exogenous NAD+ (eNAD) on cellular ATP content and mitochondrial ATP production.

CT1 and LS cells (S7, S8, V1) were cultured in glucose- or galactose medium for 24 h and analyzed. a Effect of the various treatments on the average cellular ATP content in control (CT1) and LS cells (N = 5, n ≥ 45). b Effect of the various treatments (see legend in a), in the absence and presence of Oligomycin (10 µM, 30 min), on the average cellular ATP content in control (CT1) and LS cells (N = 4, n ≥ 36). c Effect of the various treatments (see legend in a) on the Oligomycin-induced drop in cellular ATP content, reflecting the contribution of OXPHOS-derived ATP production (calculated from the data in b). Statistics: *P < 0.05, **P < 0.01, ***P < 0.001, relative to the marked condition (a, b, c, d, e, f). Results for the individual cell lines are presented in Fig. S13
