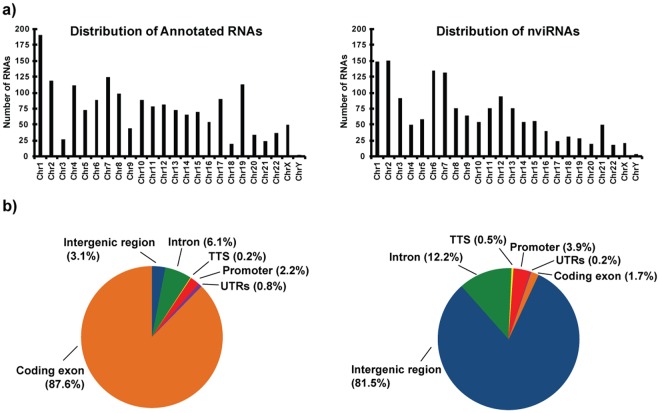
Figure 3.
Comparison of genomic distribution of Sendai virus-induced previously-annotated RNAs and nviRNAs. (a) Bar graphs represent the number of virus-induced previously-annotated RNAs (left) and nviRNAs (right) identified on each chromosome. (b) Pie charts illustrate genomic feature distribution of previously RefSeq-annotated RNAs (left) and nviRNAs (right). RNAs are mapped to one of six annotation categories: promoters, transcriptional termination sites (TTS), exons, intergenic regions, introns, and untranslated regions (UTRs; includes 5′ and 3′ UTRs), with the percentage of sites corresponding to each category displayed in parentheses near the label.

