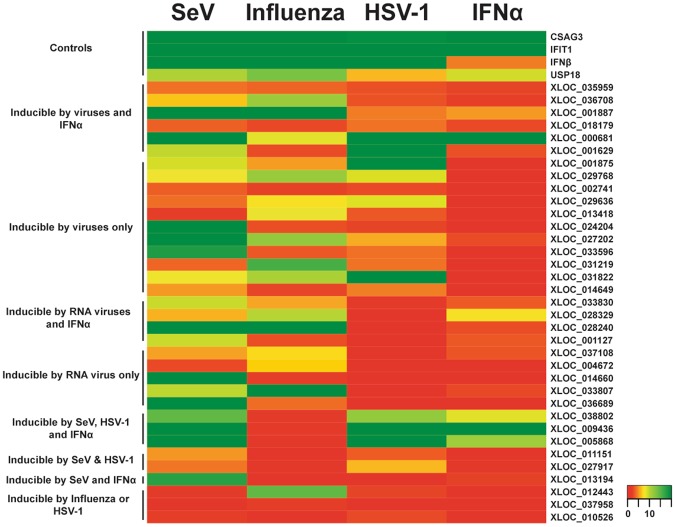
Figure 5.
Classification of nviRNA expression in Namalwa cells from various stimuli. Total RNA from Namalwa cells infected with 5 pfu/cell for 10 hours of Sendai virus (SeV), influenza A virus, or HSV-1 or directly treated with 1000 U/mL of IFNα for 6 hours was analyzed by RT-qPCR. Heat map indicates expression of each RNA after infection or treatment with IFNα. Average values (n = 3) of fold change are reported normalized to GAPDH expression.

