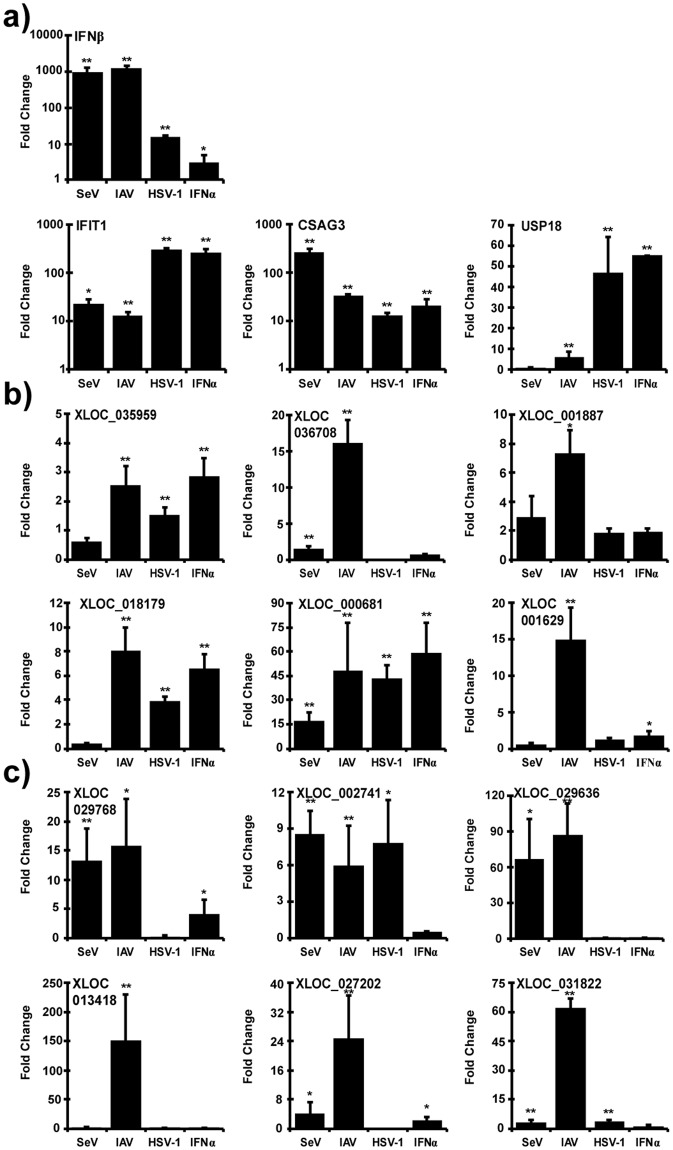
Figure 7.
nviRNA expression in THP-1 cells. Total RNA from THP-1 cells infected with 5 pfu/cell Sendai virus (4 hours), influenza A virus (IAV; 10 hours) or HSV-1 (10 hours) or directly treated with IFNα (6 hours) was analyzed by RT-qPCR. Gene-specific primers were used for (a) control genes, (b) nviRNAs inducible by viruses and IFNα in Namalwa cells and (c) nviRNAs only inducible by viruses in Namalwa cells. Data is representative of ≥2 replicate experiments and is shown normalized to GAPDH expression. Bars indicate average values of technical replicates (n = 3) with error bars representing standard deviation. Statistical analysis was done using a two-tailed Student’s t-test (*p-value < 0.05, **p-value < 0.005).

