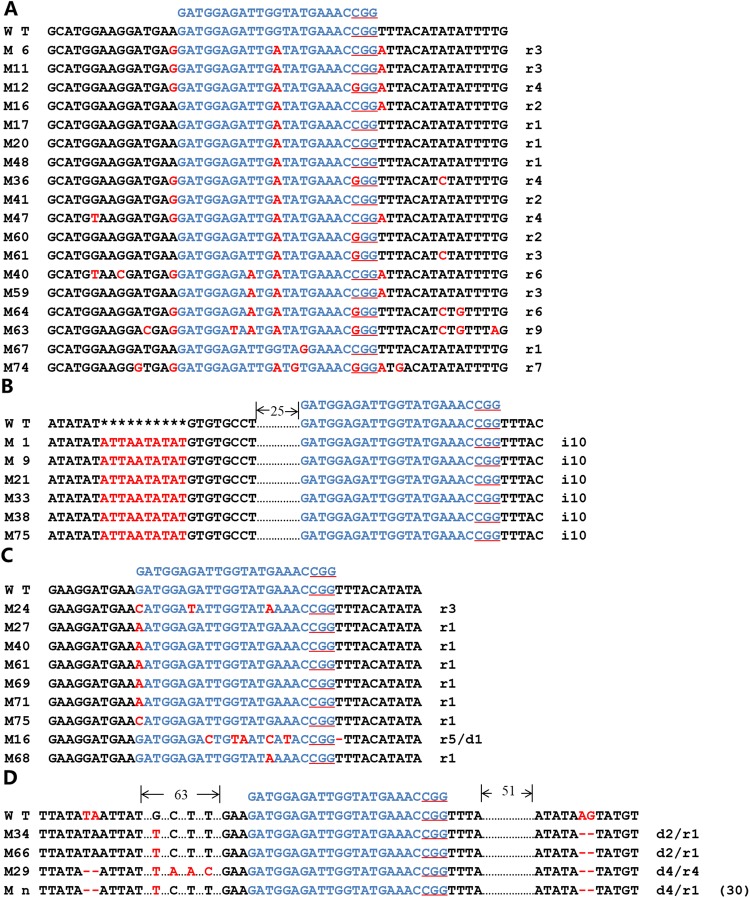
Figure 5.
CRISPR/Cas9 system-induced mutation detection in Chinese kale mutants. (A) BaPDS1 mutations at the target site; (B) BaPDS1 mutations within introns; (C) BaPDS2 mutations at the target site; (D) BaPDS2 mutations within introns. The target sequence is indicated in blue, the PAM sequence (NGG) is underlined in red, mutated bases are indicated in red font, the short line represents the deletion base, and the asterisks indicate the spacing between bases. i #, # number of base insertions. r #, # number of base replacements. d #, # number of base deletions. The number of identical mutations is indicated in parentheses. Mn contains strains M4, M7, M8, M9, M10, M11, M12, M13, M20, M23, M26, M31, M32, M33, M36, M37, M38, M41, M42, M44, M45, M48, M50, M55, M57, M60, M65, M70, M72, M73.

