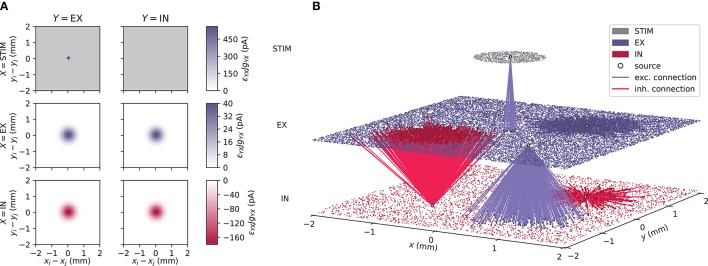
Figure 1.
Geometry and connectivity of a layered point-neuron network. (A) Schematic illustration of distance-dependent network connectivity using connectivity pattern tables (Nordlie and Plesser, 2010). Each row represents source populations X ∈ {STIM, EX, IN}, and each column target populations Y ∈ {EX, IN}. The color coding in each image shows the connection intensity between presynaptic neurons j and postsynaptic neurons i located in (xj, yj) and (xi, yi) with origin (0, 0) at the center. The connection intensities are defined as the product between pairwise connection probabilities ϵYX(rij) and synapse strengths gYXJ for each respective connection. Gray values denote connection intensities of zero. (B) Illustration of one network instantiation with randomly drawn neuron positions and outgoing connections from a subset of neuronal units. The colored dots represent individual units at their (x, y)-coordinates. Gray dots denote units in a stimulus (STIM) layer, blue dots excitatory (EX) units, and red dots inhibitory (IN) units. Blue and red lines denote excitatory and inhibitory connections respectively, from a source unit (white circles) onto neurons within the same or another layer.

