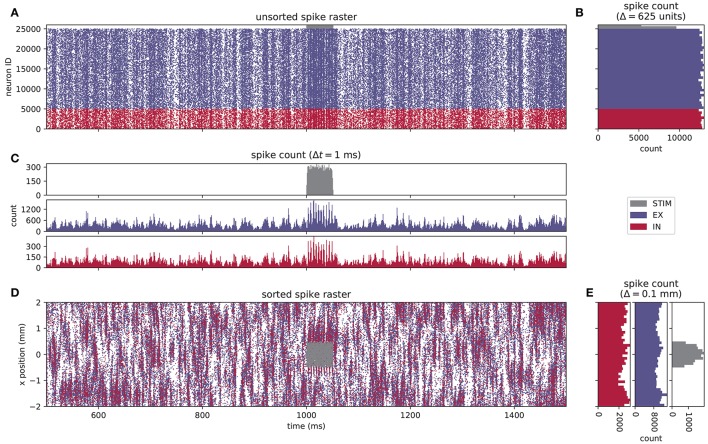
Figure 2.
Spiking activity of a layered point-neuron network model. (A) Spike raster plot for STIM (gray dots), EX (blue dots), and IN (red dots) units from a simulation of the network instantiation depicted in Figure 1B. Each individual dot corresponds to a unit ID vs. spike time; only the spikes of every fifth neuron are shown in the raster. The color coding for each population is reused in the subsequent panels. (B) Spike count histogram across units in each population, calculated using a bin width of 625 units, sorted by neuron index j. (C) Spike count histogram for each population across time, computed using a temporal bin width Δt = 1 ms. (D) Sorted spike raster where dots correspond to the spatial location (projected onto the x−axis) and spike times of each unit. The raster-plot density is diluted as in (A). (E) Spike count histogram across spatial bins with a width Δl = 0.1 mm.

