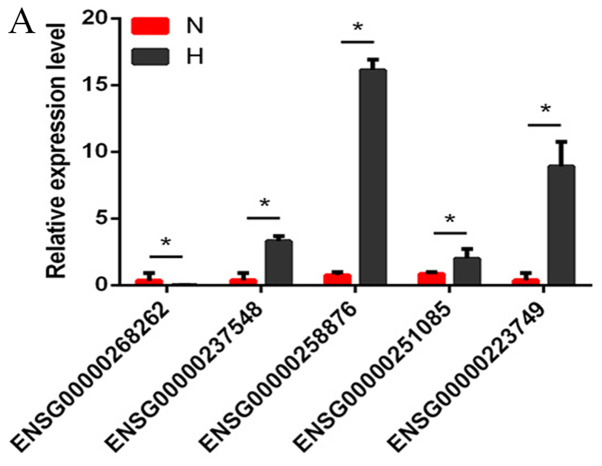
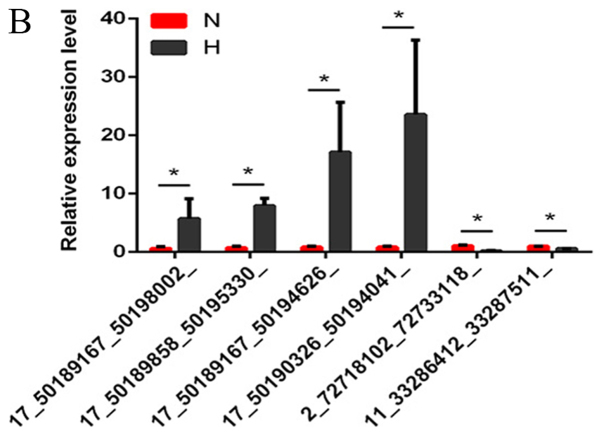
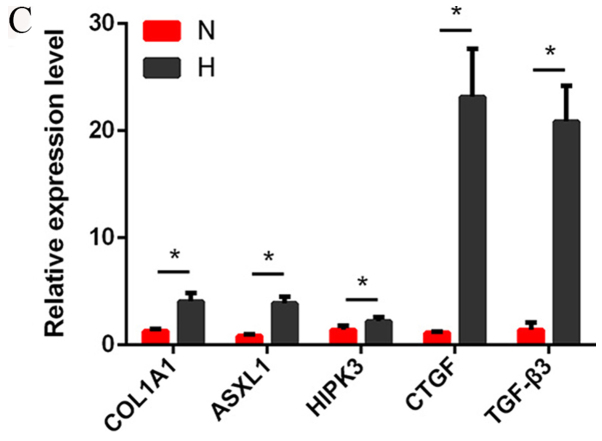
Figure 2.
Verification of the expression of significantly dysregulated genes by reverse transcription-quantitative polymerase chain reaction. The relative expression levels of (A) five long noncoding RNAs, (B) six circular RNAs and (C) five mRNAs were detected in N and H groups. Data are presented as mean ± SD, *P<0.05. ASXL1, ASXL transcriptional regulator 1; COL1A1, collagen type I A1 chain; CTGF, connective tissue growth factor; H, hypertrophic scar tissues; HIPK3, homeodomain interacting protein kinase 3; N, normal tissues; TGF-β3, transforming growth factor β3.


