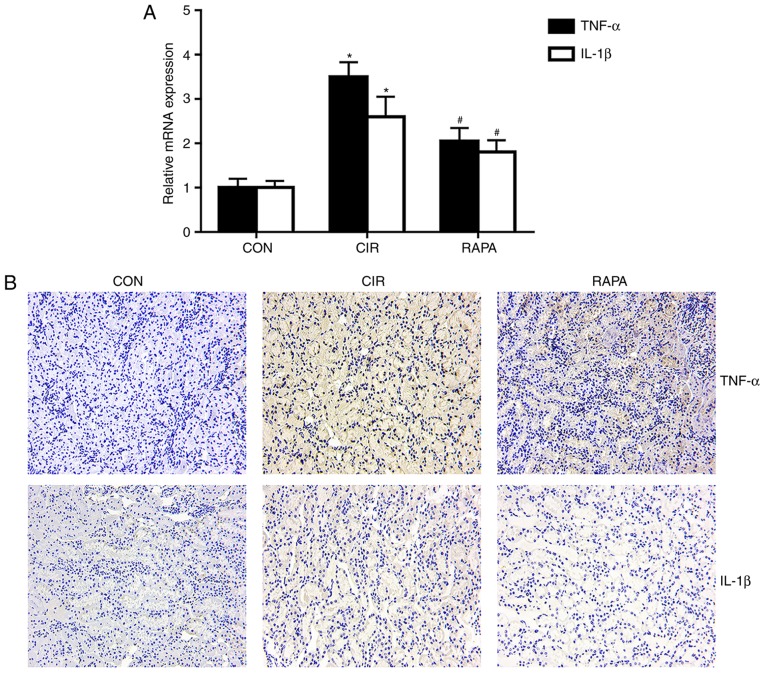
Figure 2.
Renal inflammation in rats from each group. (A) Relative mRNA expression levels of TNF-α and IL-1β in the kidney tissues of rats were evaluated by reverse transcription-quantitative polymerase chain reaction analysis. (B) Representative images of the expression of TNF-α and IL-1β from immunohistochemistry (×200 magnification). The results are presented as the mean ± standard deviation. n=10/group. *P<0.05 CIR vs. CON; #P<0.05 RAPA vs. CIR. CON, control group; CIR, cerebral ischemia-reperfusion; RAPA, rapamycin pre-treatment prior to CIR; TNF-α, tumor necrosis factor-α; IL-1β, interleukin-1β.

