Figure 2.

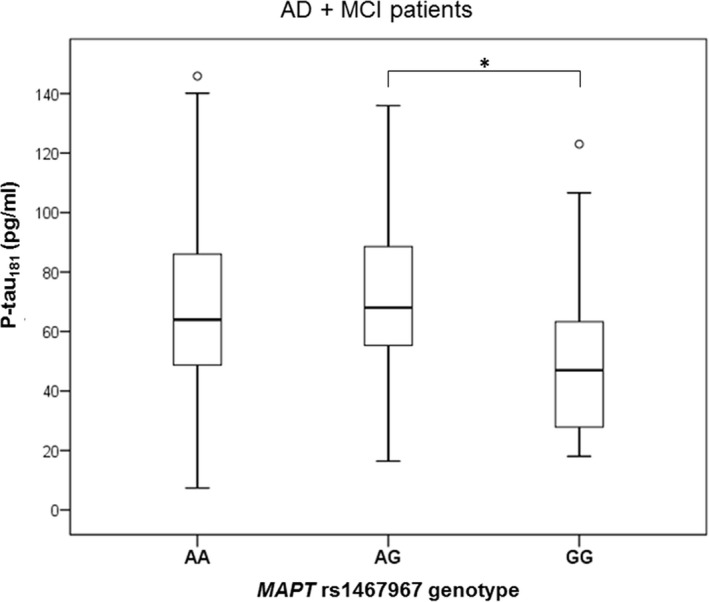
Levels of p‐tau181 in AD and MCI patients with MAPT rs1467967 genotype. Boxes represent the median, the 25th and 75th percentiles, and bars indicate the range of data distribution. Circles represent outliers. *p < 0.05

Levels of p‐tau181 in AD and MCI patients with MAPT rs1467967 genotype. Boxes represent the median, the 25th and 75th percentiles, and bars indicate the range of data distribution. Circles represent outliers. *p < 0.05